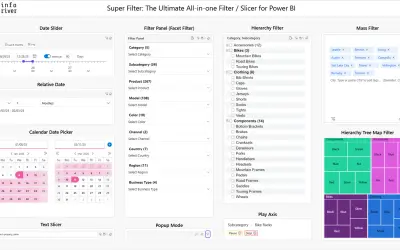
Inforiver Super Filter
A free Power BI filter/slicer that consolidates multiple filters into a single panel, with mass filtering, presets, and search.
xViz LLC dba LumelPaid
Animate Power BI report visuals by stepping through time periods or ordered categories.
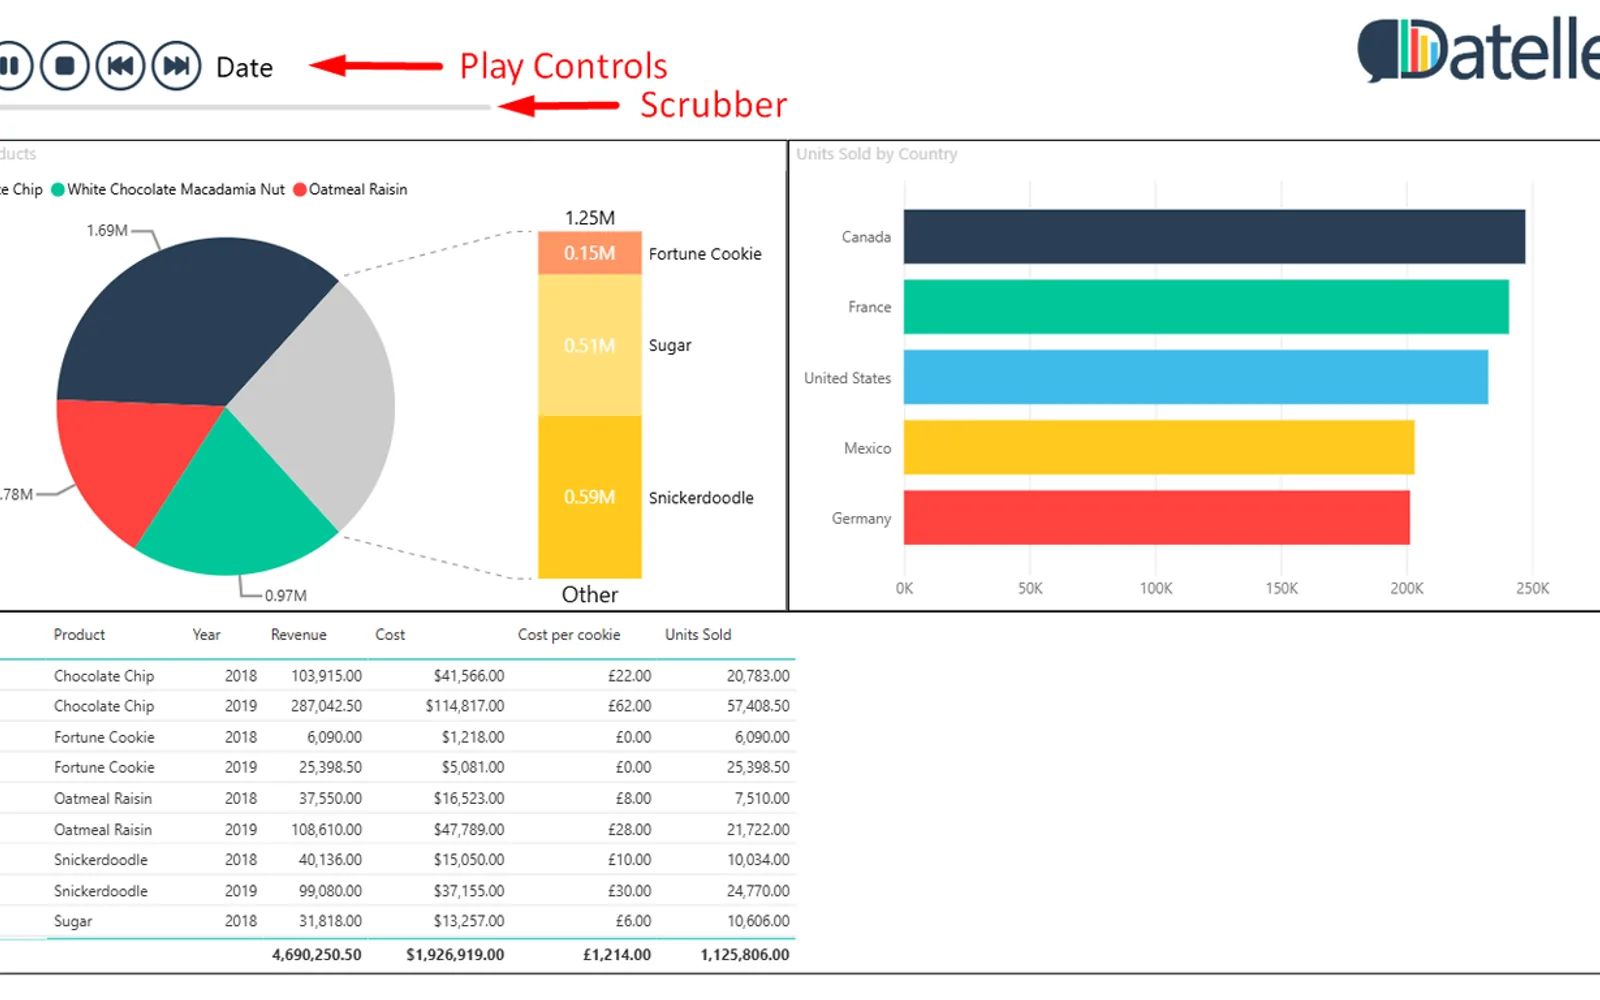
Data Play is a custom visual for Power BI that advances a selection through time-based or ordered data. Playback can run at a chosen interval, with controls for pausing, stopping, moving forward, moving back, and jumping to a selected point. It also supports hierarchical navigation, custom sequencing, captions, interface settings, looping, and continuous playback.
Controls move through time periods or ordered categories during playback.
A scrubber selects a specific point in the data sequence.
Drilldown can be used when the playback field contains category levels.
A Sort By field determines the order in which categories are shown.
Optional text identifies the data point currently selected.
Buttons, icons, colors, and single-button display can be adjusted.
Playback supports configurable timing, automatic looping, and continuous operation.
Datellers Data Play, Inforiver Super Filter, PieChart by iFour, and Smart Filter Pro by OKVIZ are all listed as paid cloud offerings. Data Play was updated on Jun 2026, while Inforiver Super Filter shows May 2026, Smart Filter Pro by OKVIZ shows Dec 2025, and PieChart by iFour shows Nov 2025.
| Name | Pricing | Deployment | Updated |
|---|---|---|---|
| this plugin | Paid | Cloud | |
| Inforiver Super Filter | Paid | Cloud | |
| PieChart by iFour | Paid | Cloud | |
| Smart Filter Pro by OKVIZ | Paid | Cloud |
657 plugins in Power BI · Analytics
Price distribution: 73 free, 108 freemium, 441 paid, 35 price not published
A free Power BI filter/slicer that consolidates multiple filters into a single panel, with mass filtering, presets, and search.
xViz LLC dba Lumel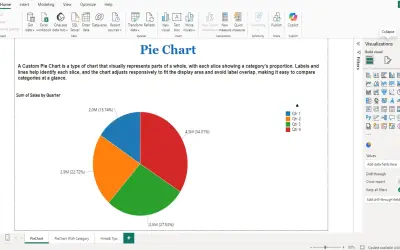
PieChart by iFour divides data into colored slices to visualize parts-to-whole relationships within Power BI reports.
iFour Technolab Pvt. Ltd.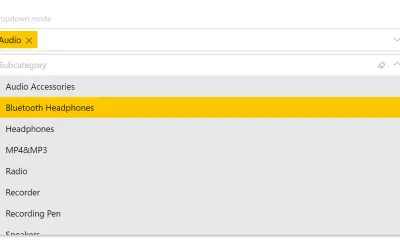
Smart Filter Pro by OKVIZ provides multiple filter modes (drop-down, multi-select, search, hierarchy) for Power BI reports.
OKVIZ Corp.
Gantt Chart is a project management visual for Microsoft Power BI that tracks schedules, milestones, and resource workloads.
ChartPad«Bring your Power BI reports to life with automated storytelling. Data Play by Datellers is a dynamic Power BI custom visual that acts as an intelligent playback slicer. It automatically cycles through time or ordered categories, allowing your report visuals to animate and evolve without manual filtering. This makes it …»