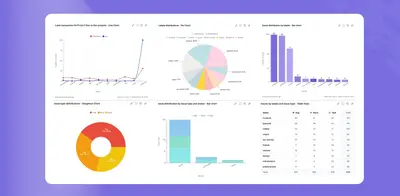
Charts - Reports and Graphs for Jira Dashboard
Create Jira dashboard charts and reports from issue data using multiple visual formats and filters.
Yamuno SoftwareFree
Create configurable bar charts from Jira issue data using JQL filters.
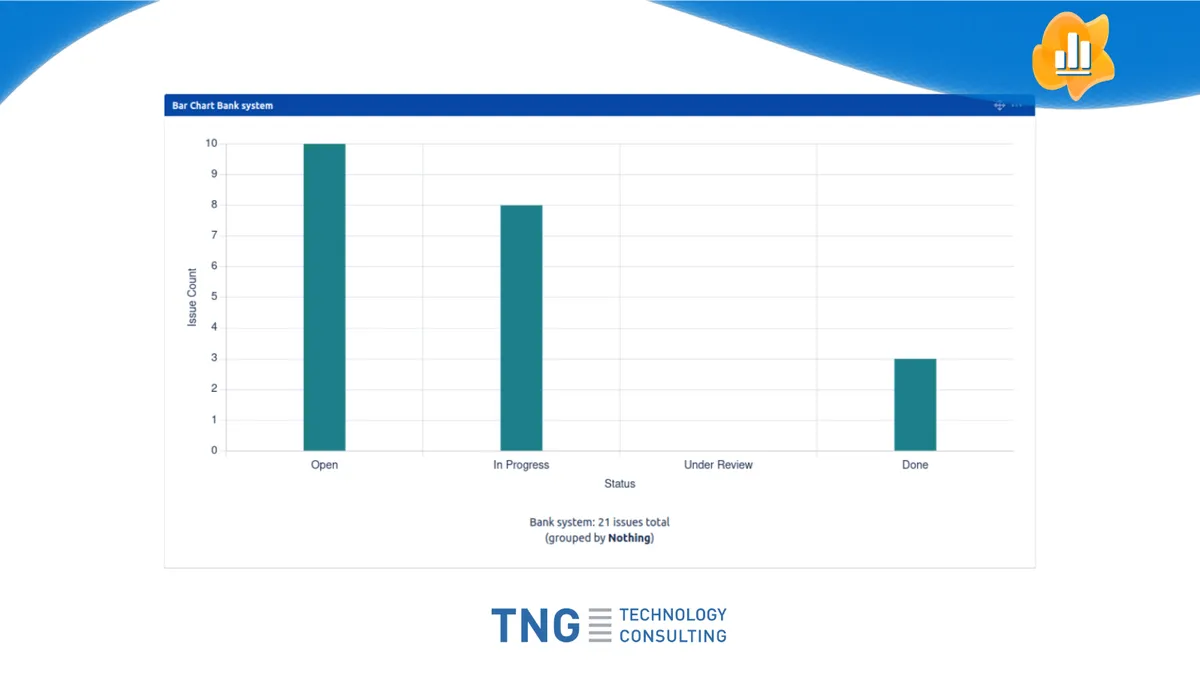
Creates configurable bar charts for Jira dashboards from issues selected with JQL filters. A field can define the x-axis, while a numeric field defines the y-axis. Issues can be grouped by another field to produce stacked charts with multiple datasets. A two-dimensional data table can appear below the chart, and chart height and refresh intervals can be configured.
Uses Jira Query Language filters to select the issues shown in a chart.
Defines fields for the x-axis and y-axis of a bar chart.
Groups issues by another field to display multiple datasets in one chart.
Shows a two-dimensional table summarizing the issues below the chart.
Configures chart height and the refresh interval.
Bar Charts for Jira is paid and supports data-center, cloud, and server deployment. Charts - Reports and Graphs for Jira Dashboard is free and cloud-only, while Visualizer for Jira is paid with data-center, cloud, and server deployment. Bar Charts for Jira and Charts - Reports and Graphs for Jira Dashboard were both updated in Sep 2026.
| Name | Pricing | Deployment | Updated |
|---|---|---|---|
| this plugin | Paid | Cloud · Data Center · Server | |
| Charts - Reports and Graphs for Jira Dashboard | Free | Cloud | |
| Visualizer for Jira | Paid | Cloud · Data Center · Server |
630 plugins in Jira · Data and analytics
Price distribution: 189 free, 230 freemium, 211 paid
Create Jira dashboard charts and reports from issue data using multiple visual formats and filters.
Yamuno Software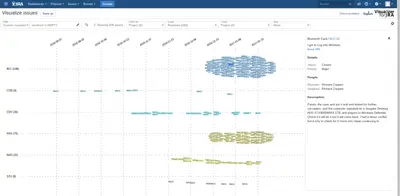
Visualize Jira work items by projects, work types, sprints, assignees, or custom fields.
GLiNTECH - a Valiantys company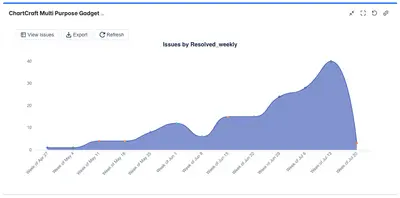
Build Jira dashboards with charts, workflow metrics, custom-field analysis, and PNG or CSV exports.
White Software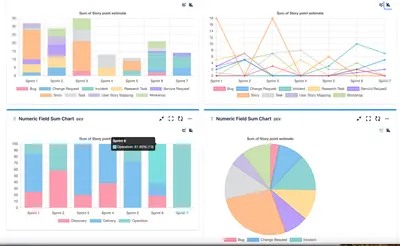
Create Jira dashboard charts and tables from numeric custom fields, grouped by dates, sprints, issues, epics, assignees, or other fields.
erin«Bar Charts for Jira allows you to add fully configurable bar charts to your Jira dashboards. Use the full power of the Jira Query Language (JQL) to filter a set of Jira issues. Specify a field to represent the x-axis of the chart. Specify a numeric field for the y-axis of the chart. Optionally, group your issues by …»