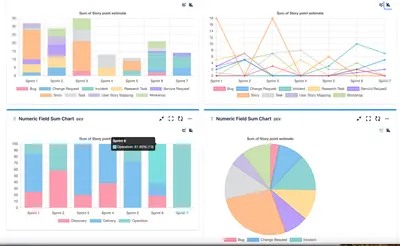
Numeric Custom Field Chart
Create Jira dashboard charts and tables from numeric custom fields, grouped by dates, sprints, issues, epics, assignees, or other fields.
erinFree
Build Jira dashboards with charts, workflow metrics, custom-field analysis, and PNG or CSV exports.
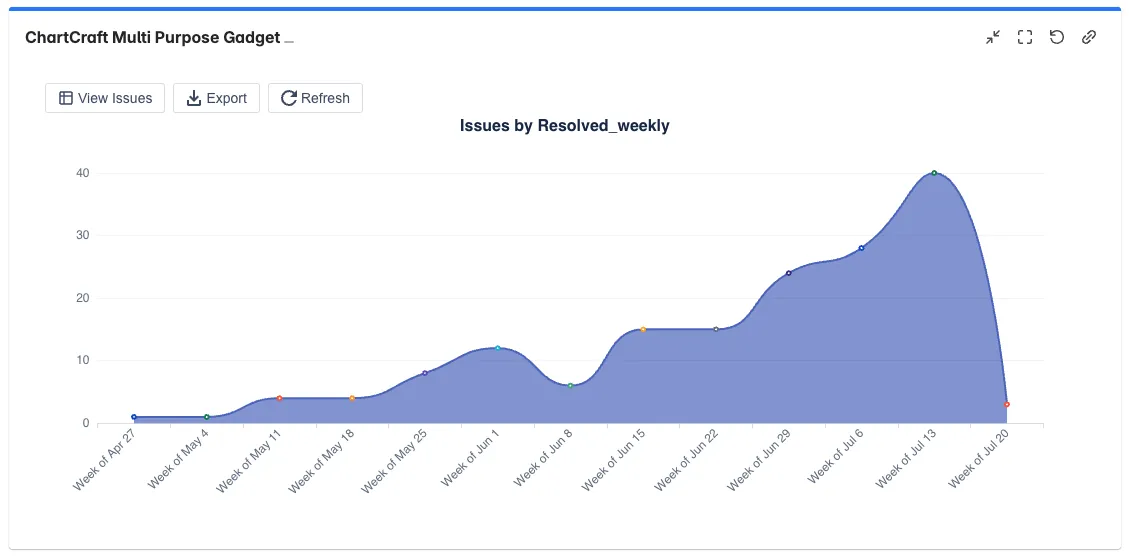
Turns Jira data into visual reports using standard, advanced, Agile, and flow-metric charts. Data can be grouped by status, priority, assignee, issue type, custom fields, time period, or sprint. The add-in calculates issue counts, story points, time-tracking values, cycle time, lead time, and work item age. Charts can be exported as PNG images or CSV files, with configurable refresh rates.
Offers bar, line, area, pie, donut, bubble, heat-map, tag-cloud, stacked, and Agile chart types.
Groups Jira data by status, priority, assignee, issue type, custom fields, time periods, or sprints.
Calculates issue counts, story points, time-tracking values, and totals from custom numeric fields.
Uses changelog history for status reconstruction, WIP threshold detection, and outlier highlighting.
Measures cycle time and lead time with 50th, 85th, and 95th percentile analysis.
Tracks work item age and provides threshold highlighting.
Exports charts as PNG images or CSV files and copies configuration to the clipboard.
ChartCraft for Jira is freemium and cloud-based. Numeric Custom Field Chart and Dashboard Insights for Jira are free and cloud-based, while Performance Objectives: Charts & Reports for Jira Dashboards is freemium and supports cloud, server, and data-center deployments. ChartCraft for Jira was updated in Mar 2026; the listed alternatives were updated in Jul 2026 or Sep 2026.
| Name | Pricing | Deployment | Updated |
|---|---|---|---|
| this plugin | Freemium | Cloud | |
| Numeric Custom Field Chart | Free | Cloud | |
| Dashboard Insights for Jira | Free | Cloud | |
| Performance Objectives: Charts & Reports for Jira Dashboards | Not in catalog | ||
630 plugins in Jira · Data and analytics
Price distribution: 189 free, 230 freemium, 211 paid
Create Jira dashboard charts and tables from numeric custom fields, grouped by dates, sprints, issues, epics, assignees, or other fields.
erin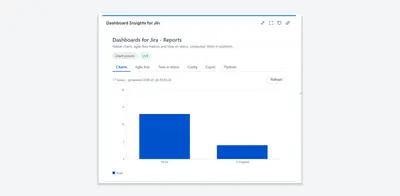
Create Jira dashboard charts, Agile reports, and time-in-status metrics from saved JQL queries.
Ivars Apps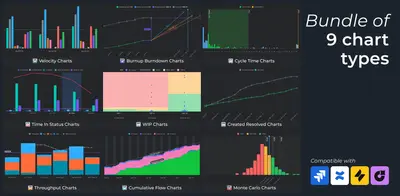
Analyze Jira delivery, sprint, flow, forecasting, and cycle-time data with reports and dashboard gadgets.
Broken Build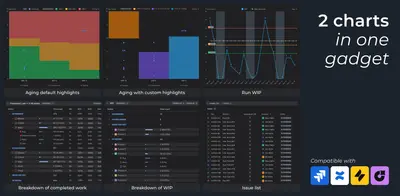
Track Jira work-in-progress aging and volume over time with configurable WIP charts and dashboard gadgets.
Broken Build«Velocity, Burndown, Burnup Charts 🎯 Flexible Grouping Group by Status, Priority, Assignee, Issue Type, or any custom field. Time-based trends (daily/weekly/monthly). Multi-dimensional stacked charts. Sprint-based grouping for Agile charts. 📈 Advanced Metrics Issue counts, Story Points, time tracking, custom numeric …»