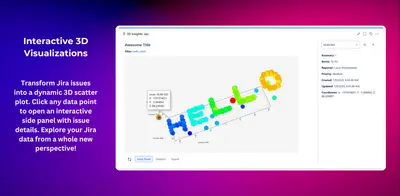
3D Insights for Jira
Visualize Jira issues in interactive 3D charts with configurable fields, axes, graph styles, and issue details.
Lumo Łukasz ModzelewskiFreemium
Visualize Jira work items by projects, work types, sprints, assignees, or custom fields.
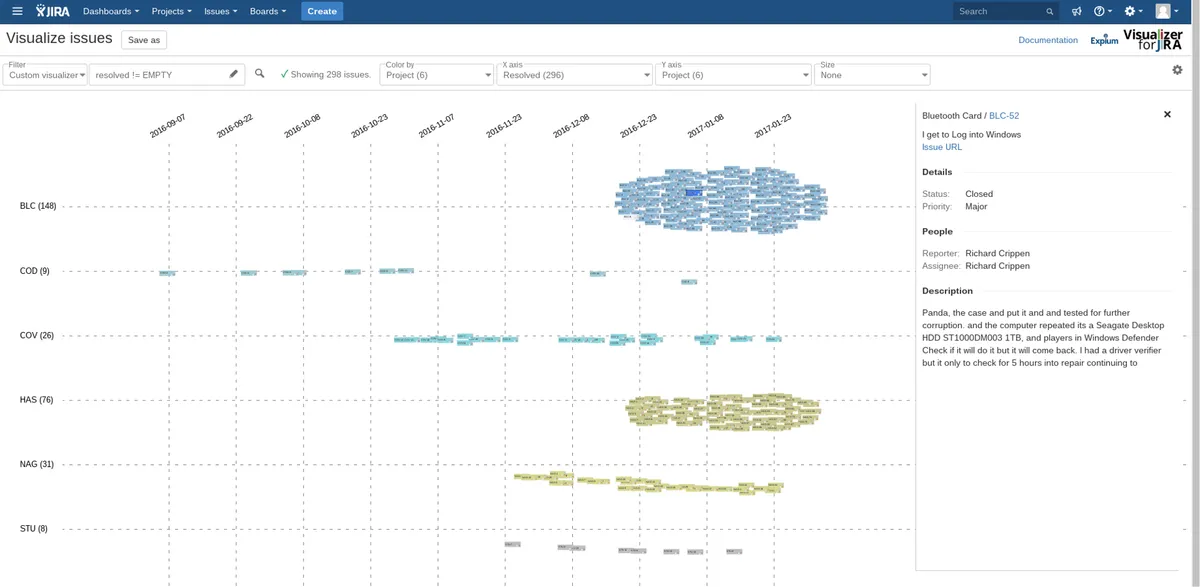
Visualizer displays Jira work items on a zoomable, scrollable canvas. A configuration panel controls the filter, query, and visual representation, with updates applied when settings change. Jira fields can determine card color, position, size, and caption. Advanced options include field visibility, axis spacing, grouping preference, and physics parameters.
Issues can be selected with a custom query or a favorite filter.
Jira fields can group issue cards along the X and Y axes.
Fields can control issue color, screen position, card size, and caption.
Issue links are available as a visualization configuration option.
Advanced settings include field visibility, axis spacing, grouping preference, and physics parameters.
Issues are displayed on a canvas that supports zooming and scrolling.
Visualizer for Jira is paid and available for data-center, cloud, and server, unlike 3D Insights for Jira, which is freemium and cloud-only, and Charts - Reports and Graphs for Jira Dashboard, which is free and cloud-only. Bar Charts for Jira shares Visualizer for Jira's paid pricing and data-center, cloud, and server deployment. Visualizer for Jira was updated in Dec 2025, while 3D Insights for Jira, Charts - Reports and Graphs for Jira Dashboard, and Bar Charts for Jira were updated in Mar 2026, Sep 2026, and Sep 2026 respectively.
| Name | Pricing | Deployment | Updated |
|---|---|---|---|
| this plugin | Paid | Cloud · Data Center · Server | |
| 3D Insights for Jira | Freemium | Cloud | |
| Charts - Reports and Graphs for Jira Dashboard | Free | Cloud | |
| Bar Charts for Jira | Paid | Cloud · Data Center · Server |
630 plugins in Jira · Data and analytics
Price distribution: 189 free, 230 freemium, 211 paid
Visualize Jira issues in interactive 3D charts with configurable fields, axes, graph styles, and issue details.
Lumo Łukasz Modzelewski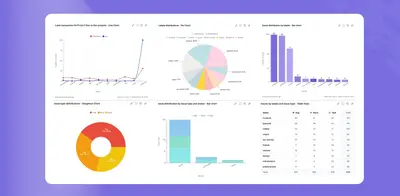
Create Jira dashboard charts and reports from issue data using multiple visual formats and filters.
Yamuno Software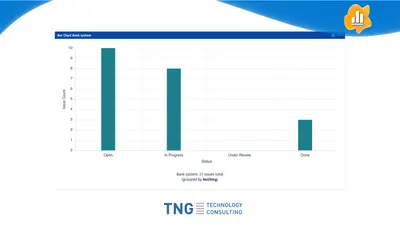
Create configurable bar charts from Jira issue data using JQL filters.
TNG Technology Consulting GmbH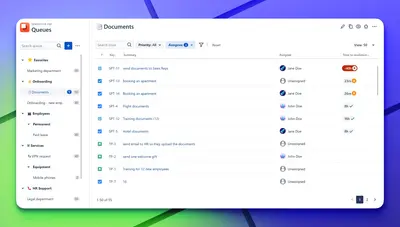
Organizes Jira and JSM issues from multiple projects into shared queues with access controls and queue management.
Deviniti«Configuration The process is driven by a configuration panel at the top of the page. As soon as you change any of the settings, the visualisation will be updated to match your configuration. Filter and query The filter and query define what issues will be visualized. Choose between a custom query or any of your …»