
Gantt Chart
Gantt Chart is a project management visual for Microsoft Power BI that tracks schedules, milestones, and resource workloads.
ChartPadFree
Display base64-encoded PDF documents in Power BI with page navigation, zoom, and configurable viewer controls.
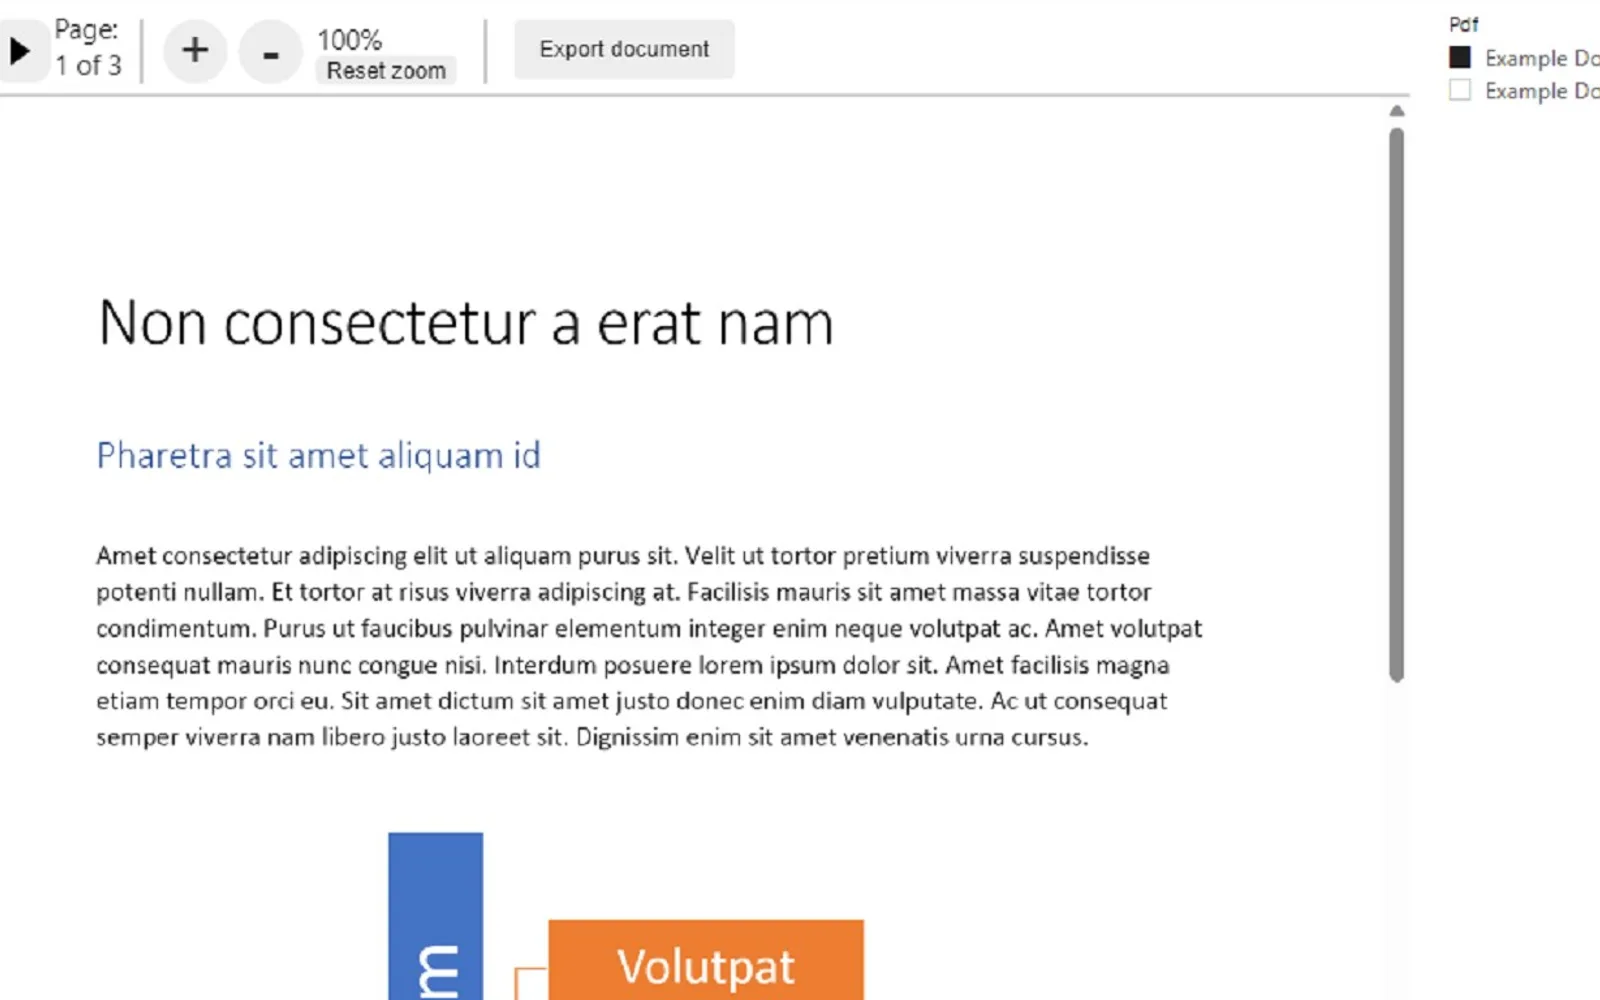
Reads PDF documents from the Power BI data model as base64-encoded strings and displays one document at a time. The viewer includes controls for changing pages and zooming. Format settings can show or hide header controls and overflow scrolling. Licensed editions can export documents and use measures for PDF data and exported filenames.
Displays PDF documents from base64-encoded strings stored in the Power BI data model.
Provides controls for switching between pages in a displayed PDF.
Provides controls for zooming in and out of the document.
Allows header controls and overflow scrolling to be shown or hidden.
The licensed version can export displayed documents to a file.
The licensed version supports measures for base64 data and exported filenames.
693 plugins in Power BI · Analytics
Price distribution: 73 free, 108 freemium, 471 paid, 41 price not published
Gantt Chart is a project management visual for Microsoft Power BI that tracks schedules, milestones, and resource workloads.
ChartPad
Creates visualizations from diverse chart types, combines multiple charts on one canvas, and adds custom annotations and tooltips.
Akvelon
Creates financial and business reports in Power BI with automatic variance calculations, P&L logic, and drill-down (s5, s6).
Zebra BI
AI analysis app for Dynamics 365 Business Central that provides customer KPIs, churn probability, and customer grouping.
Data Courage«This visual utilizes the PDF JS javascript library (https://mozilla.github.io/pdf.js/) to display PDF documents from base64 encoded strings. The visual reads pdfs from the Power BI data model which requires the documents to be converted into base64 encoded strings before imported into the data model. Converting pdfs …»