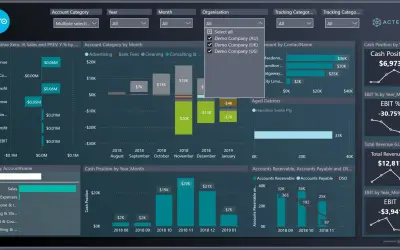
Xero Planning & Reporting by Acterys
Xero reporting and planning app for Power BI and Excel with pre-built templates, dashboards, and two-way integration.
ManagilityPaidCompare
1350 analytics apps for Microsoft 365
Xero reporting and planning app for Power BI and Excel with pre-built templates, dashboards, and two-way integration.
Managility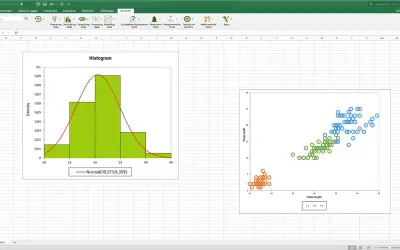
XLSTAT Basic provides data preparation, visualization, testing, modeling, data mining, and clustering tools for Excel.
ADDINSOFTXLSTAT Basic+ provides statistical tests, modeling, data mining, clustering and machine learning methods for data analysis.
ADDINSOFT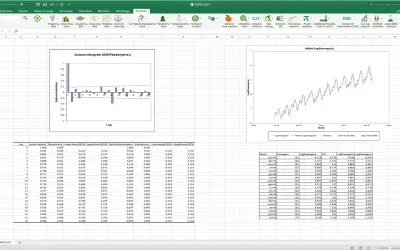
XLSTAT Forecasting provides time series forecasting methods for Excel, including Holt Winters smoothing and SARIMAX.
ADDINSOFT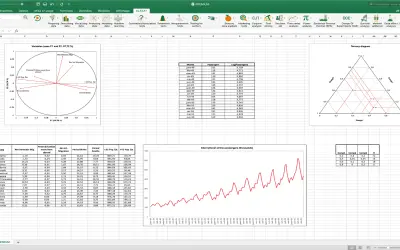
XLSTAT Premium is an add-in for Excel that provides over 220 statistical features for data preparation, analysis, and prediction.
ADDINSOFT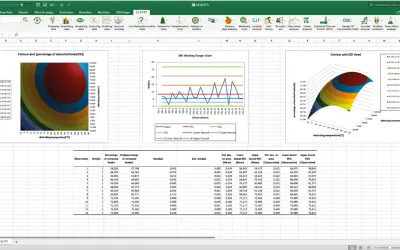
XLSTAT Quality provides risk analysis and statistical process control methods as an add-in for Microsoft Excel.
ADDINSOFT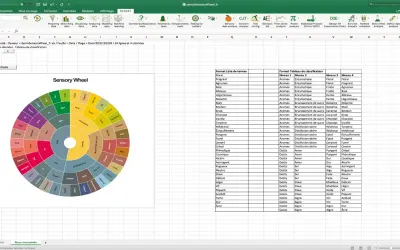
XLSTAT Sensory provides preference mapping, panel analysis, and discrimination tests for Excel-based sensory data analysis.
ADDINSOFT
XOGO Decision Signage provides an interactive digital signage package with playlist scheduling for the Windows platform.
XOGO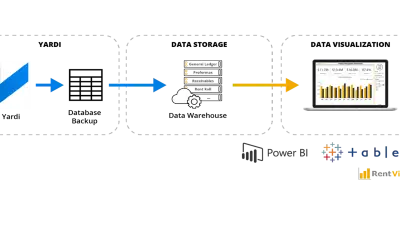
Visualize Yardi Voyager data in Power BI or Tableau using a customizable data lake and warehouse from RentViewer.
RentViewer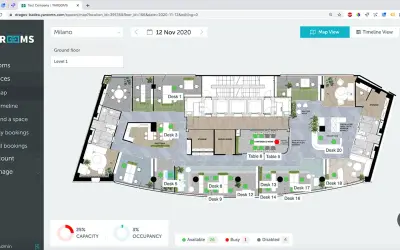
YAROOMS Workplace Experience Platform provides space booking, hybrid work planning, and visitor management for organizations.
Yarooms International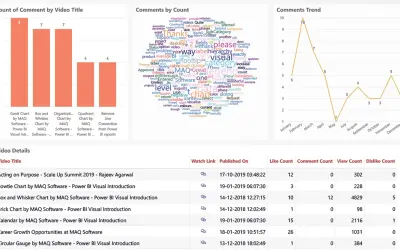
Consolidates key YouTube channel data points into a single report, giving users a quick overview to evaluate channel performance.
MAQ LLC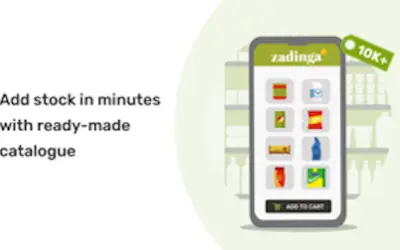
Zadinga manages inventory, billing, payments, and sales reports for shops in India selling in-store, online, and on marketplaces.
Jio Platforms Limited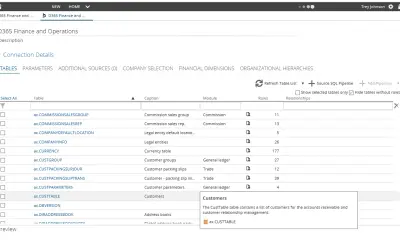
Automates data acquisition from ERP, CRM, SQL, and Excel and delivers an Azure-based data warehouse for Power BI and Tableau.
Zap BI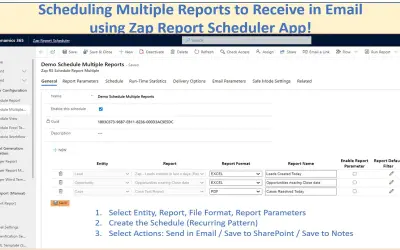
Zap Report / View Scheduler automates report and view exports to email, SharePoint, or Teams for Dynamics 365 CE and Power Apps.
Zap Objects
Zathinker analyzes business process context with generative AI, generating documentation, development code, and analytics models.
2NV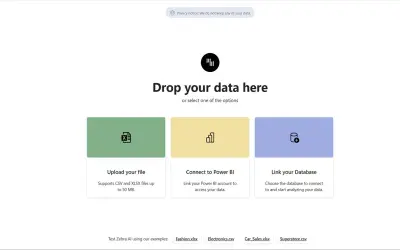
Creates interactive dashboards with AI-driven explanations, forecasts, and recommendations from uploaded business data.
Zebra BI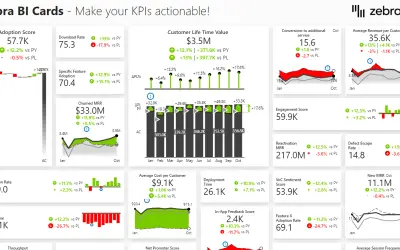
Zebra BI Cards displays multiple KPIs with variances, sparklines, and drill-through options as interactive scorecards in Power BI.
Zebra BI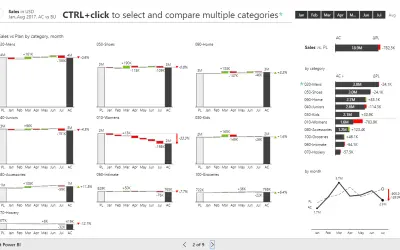
Zebra BI Charts+ extends the full Zebra BI Charts experience with viewer commenting: analysts, executives, and business reviewers can add and manage comments directly on a visual in view mode, without needing Power BI workspace edit access.
Zebra BI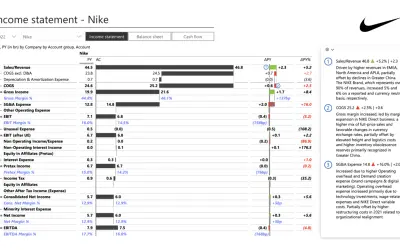
Creates financial and business reports in Power BI with automatic variance calculations, P&L logic, and drill-down (s5, s6).
Zebra BI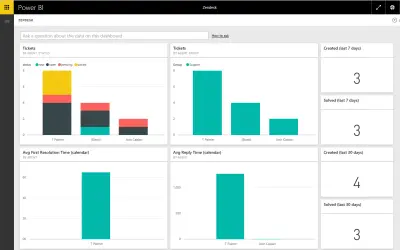
Connects a Zendesk admin account to Power BI, which creates a dashboard with reports on ticket volumes and agent performance.
Microsoft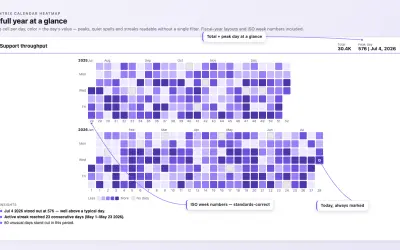
Power BI visual that shows a full year of daily values in a calendar grid with automatic insights and runs fully offline.
Zentrix Studio