
Power Plot Visual by Akvelon
Creates visualizations from diverse chart types, combines multiple charts on one canvas, and adds custom annotations and tooltips.
AkvelonFreemium
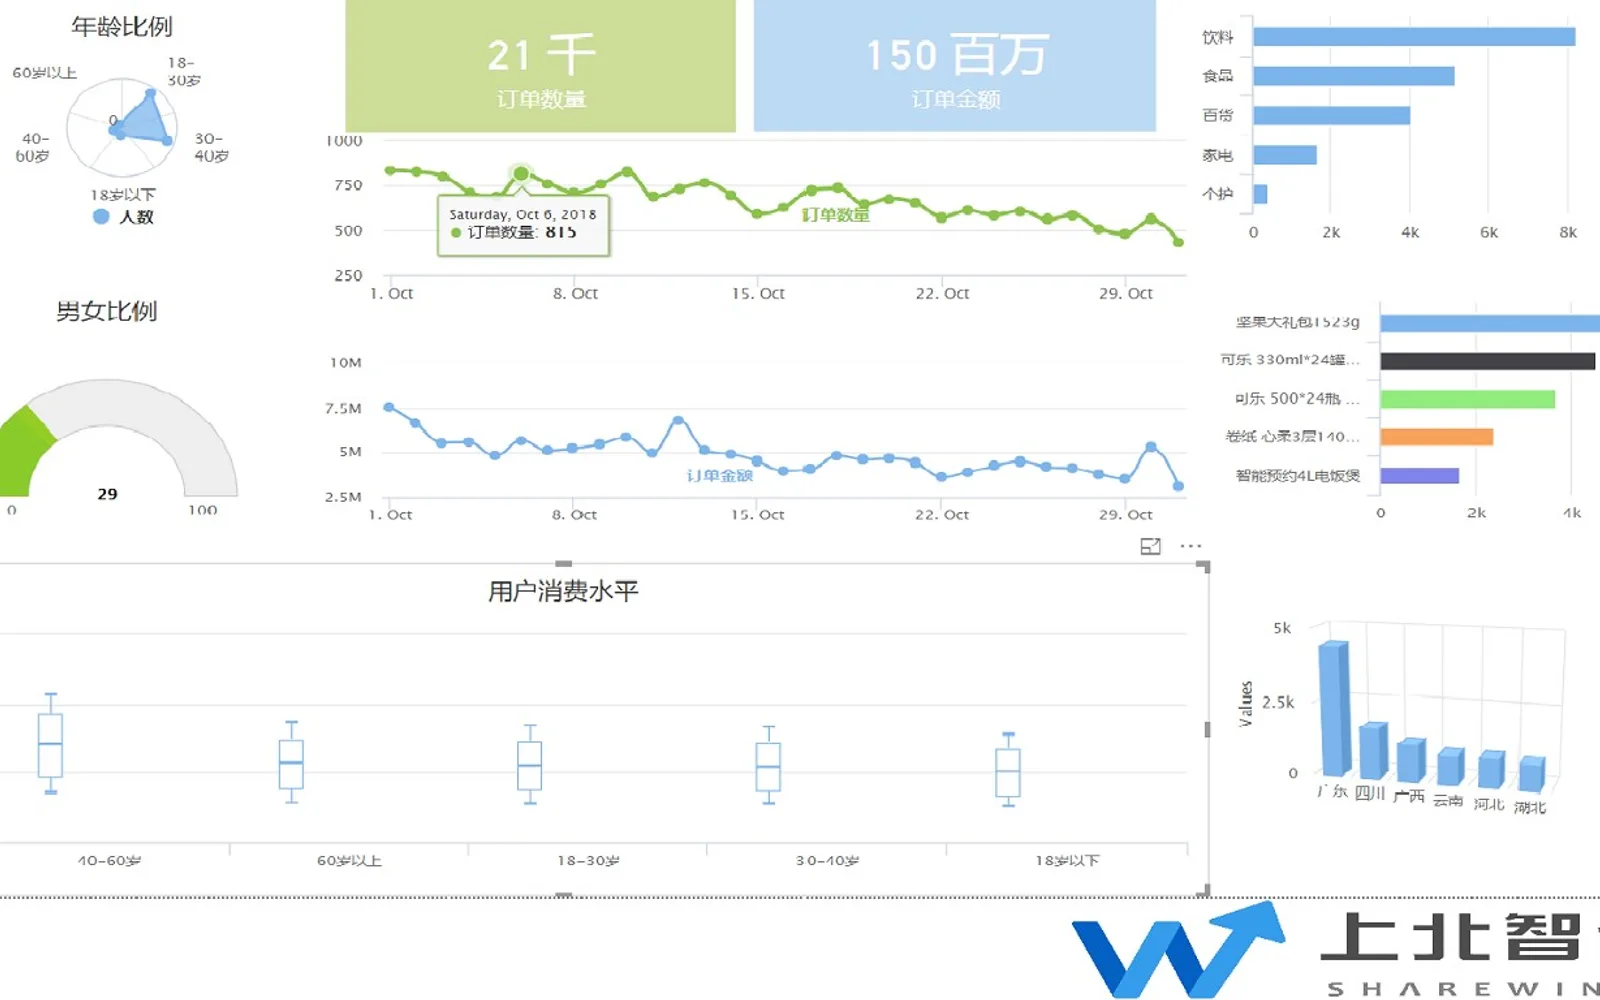
Provides advanced and basic chart configuration. It displays chart effects when settings are modified and includes templates for area, bar, line, pie, combination, polar, scatter, and bubble charts. Settings cover appearance, titles, axes, data series, data markers, legends, and tooltips.
Provides an advanced interface for chart configuration.
Displays chart effects when configuration settings are modified.
Includes area, bar, line, pie, combination, polar, scatter, and bubble chart templates.
Supports configuration of appearance, titles, axes, data series, data markers, legends, and tooltips.
2,531 plugins in Analytics
Price distribution: 125 free, 147 freemium, 1,350 paid, 909 price not published
Creates visualizations from diverse chart types, combines multiple charts on one canvas, and adds custom annotations and tooltips.
Akvelon
Creates financial and business reports in Power BI with automatic variance calculations, P&L logic, and drill-down (s5, s6).
Zebra BI
COSMO Text Module provides extended text management with a WYSIWYG editor for Microsoft Dynamics 365 Business Central.
COSMO CONSULT
Discover the why behind your data.
Data Courage«1、支持高级编辑,在高级编辑中提供强大的配置界面; 2、支持在修改配置时显示修改的图表效果; 3、支持数十种常用图表模板,可以在模板之间快速切换。 常用模板包括面积图,条形图,折线图,饼图,条形图,组合图,极坐标图,散点图和气泡图; 4、支持基本配置,配置外观,标题,轴,数据系列,数据飞镖标志,图例,提示等。»