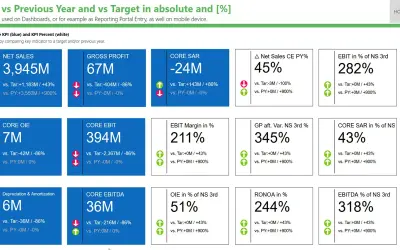
Ultimate KPI Card
Power BI custom visual that displays a measure with variance to a target and/or previous year in absolute and percentage terms.
dataviz.boutique GmbHPaid
Display multiple KPIs in Power BI with comparisons, sparklines, drill-through, and customizable card layouts.
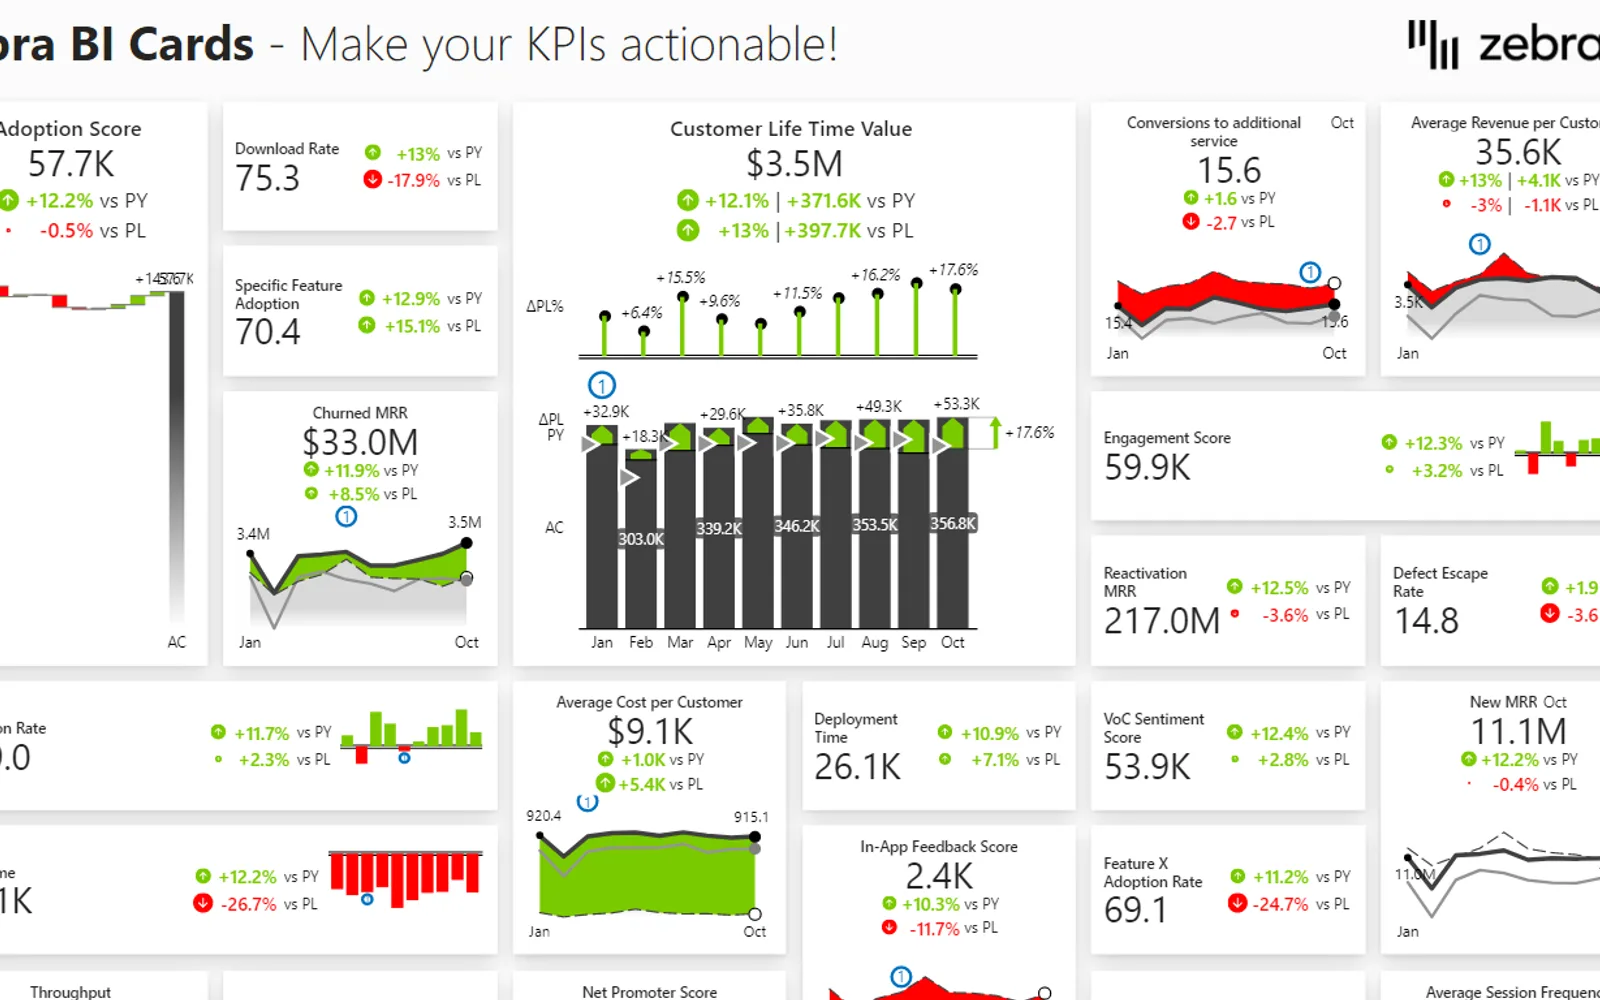
Zebra BI Cards displays multiple KPIs in one Power BI visual. It adds comparisons, variances, sparklines, and trendlines to KPI cards. The visual supports multi-card dashboards with rows, columns, and sparklines. It also includes drill-through, focus mode, chart slider, invert options, and controls for card sizing, ordering, number formats, and colors.
One visual can display multiple KPIs.
KPI cards can show comparisons, variances, sparklines, and trendlines.
Dashboards can arrange cards in rows or columns and include sparklines.
The visual includes drill-through for viewing details.
The listing names focus mode, chart slider, and invert options.
Cards can be resized, reordered, and formatted with numbers and colors.
Different KPI cards can be scaled consistently or independently.
Zebra BI Cards and Ultimate KPI Card are both listed as paid, cloud-deployed add-ins, with update dates of Aug 2026 and Feb 2026. Progress Icon is also paid and cloud-deployed, with an update date of May 2026. KPI Scorecard Report, Advance Card, and Financial Reporting Dashboard are paid and cloud-deployed, with update dates of Nov 2024, Oct 2024, and Dec 2025.
| Name | Pricing | Deployment | Updated |
|---|---|---|---|
| this plugin | Paid | Cloud | |
| Ultimate KPI Card | Paid | Cloud | |
| Progress Icon | Paid | Cloud | |
| KPI Scorecard Report | Paid | Cloud | |
| Advance Card | Paid | Cloud | |
| Financial Reporting Dashboard | Paid | Cloud |
657 plugins in Power BI · Analytics
Price distribution: 73 free, 108 freemium, 441 paid, 35 price not published
Power BI custom visual that displays a measure with variance to a target and/or previous year in absolute and percentage terms.
dataviz.boutique GmbH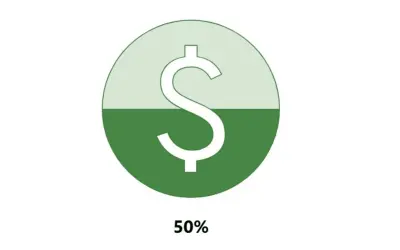
Power BI custom visual that fills an SVG icon to show KPI progress toward a target instead of a plain number on a card.
NeenOpal Inc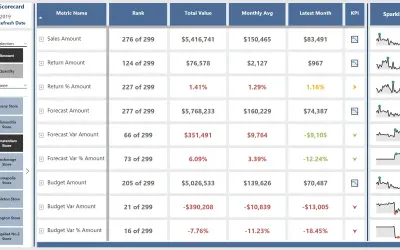
Lays out a grid of DAX measures across rows and columns using native and custom visuals to build a Power BI scorecard template.
Havens Consulting Inc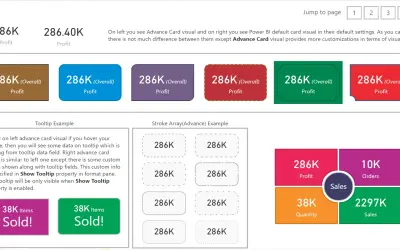
Custom card visual for Power BI that extends the default card with conditional formatting, tooltips, and alignment options.
Bhavesh Jadav«Tired of static KPI visuals in Power BI? Native card visuals display numbers, but they don't explain what's changing, why it's changing, or how KPIs relate. Zebra BI Cards transforms KPI reporting into interactive, actionable scorecards. With one visual, you can show multiple KPIs, add comparisons and sparklines, and …»