
Gantt Chart
Gantt Chart is a project management visual for Microsoft Power BI that tracks schedules, milestones, and resource workloads.
ChartPadFree
Visualize word frequency or weighted text in Power BI with an interactive word cloud.
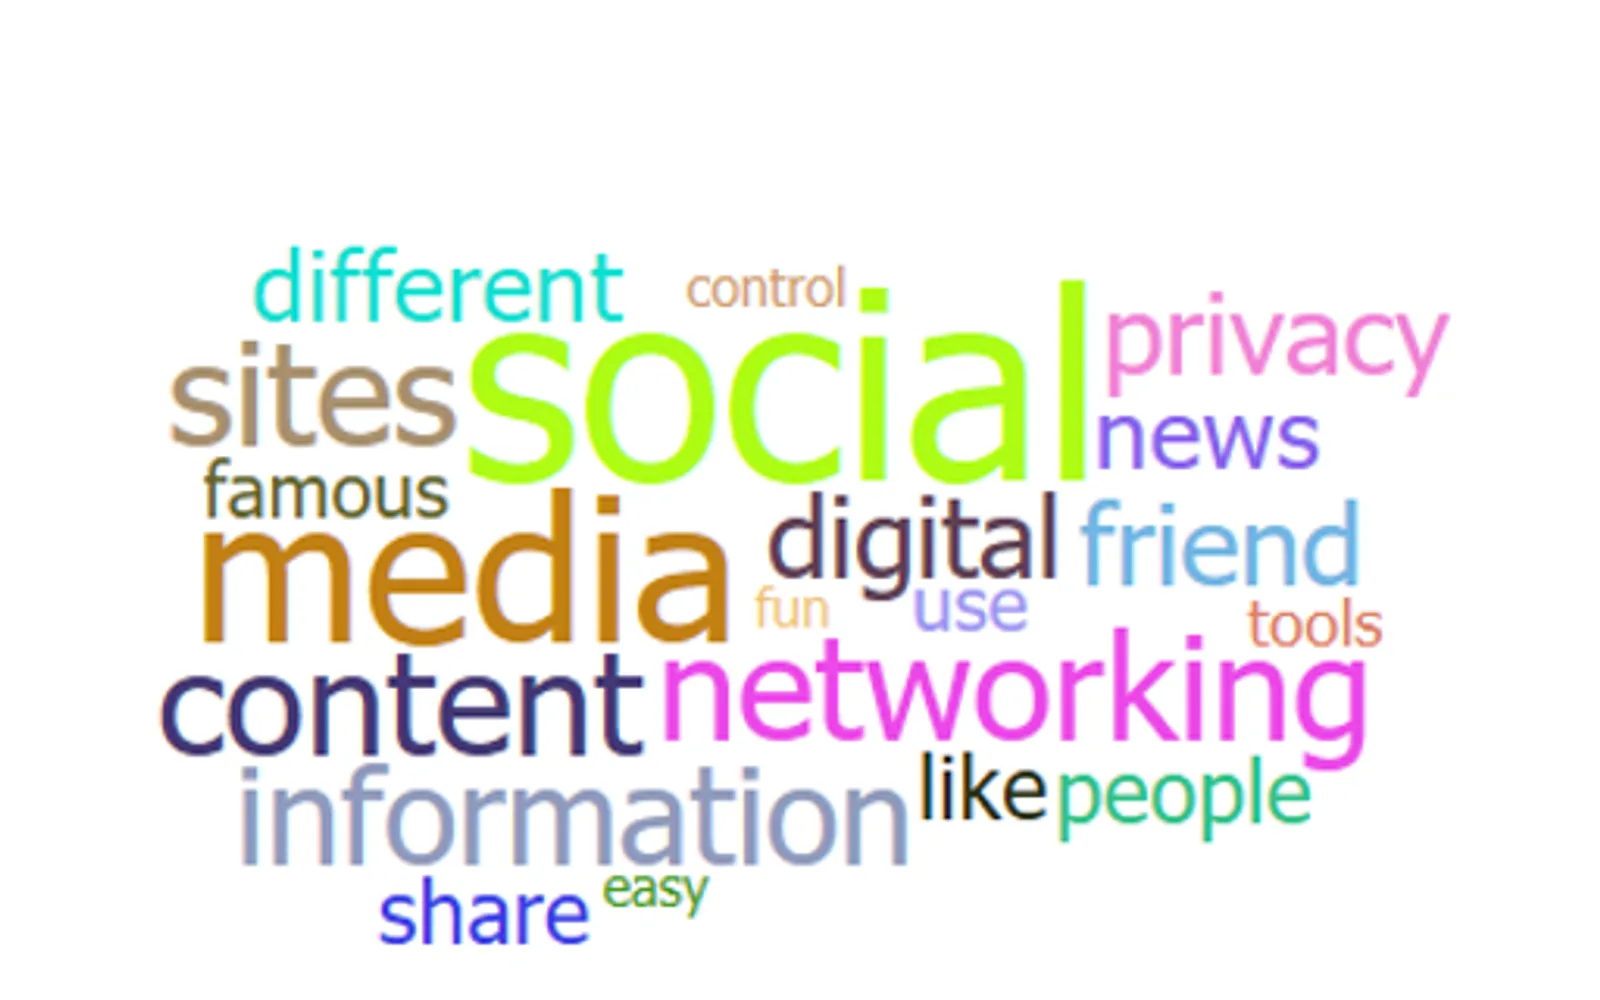
Word Cloud displays text as a visual representation of word frequency or value in Power BI. It can use word frequency when text is broken into words, or a measure as the text value when word breaking is disabled. Stop words can be removed, and word rotation and angle settings can change the visual appearance. An optional measure can assign weight to the text; without one, the visual uses frequency.
Displays words according to their frequency in the text.
Uses a measure as the value of text when word breaking is disabled.
Removes common terms from the word cloud when enabled.
Uses an optional measure to provide weight to the text.
Supports rotation and configurable angles for the displayed words.
834 plugins in Power BI · Analytics
Price distribution: 75 free, 110 freemium, 502 paid, 147 price not published
Gantt Chart is a project management visual for Microsoft Power BI that tracks schedules, milestones, and resource workloads.
ChartPad
Creates visualizations from diverse chart types, combines multiple charts on one canvas, and adds custom annotations and tooltips.
Akvelon
Creates financial and business reports in Power BI with automatic variance calculations, P&L logic, and drill-down (s5, s6).
Zebra BI
AI analysis app for Dynamics 365 Business Central that provides customer KPIs, churn probability, and customer grouping.
Data Courage«Word Cloud is a visual representation of word frequency and value. Use it to get instant insight into the most important terms in your data. With the interactive experience of Word Cloud in Power BI, you no longer have to tediously dig through large volumes of text to find out which terms are prominent or prevalent …»