
kml-kmz-visual
KML/KMZ Viewer renders points, lines, and polygons from KML and KMZ files on interactive maps within Power BI reports.
Abdalla DabesPaid
Maps report data onto Visio diagrams in Power BI from SharePoint Online or OneDrive for Business.
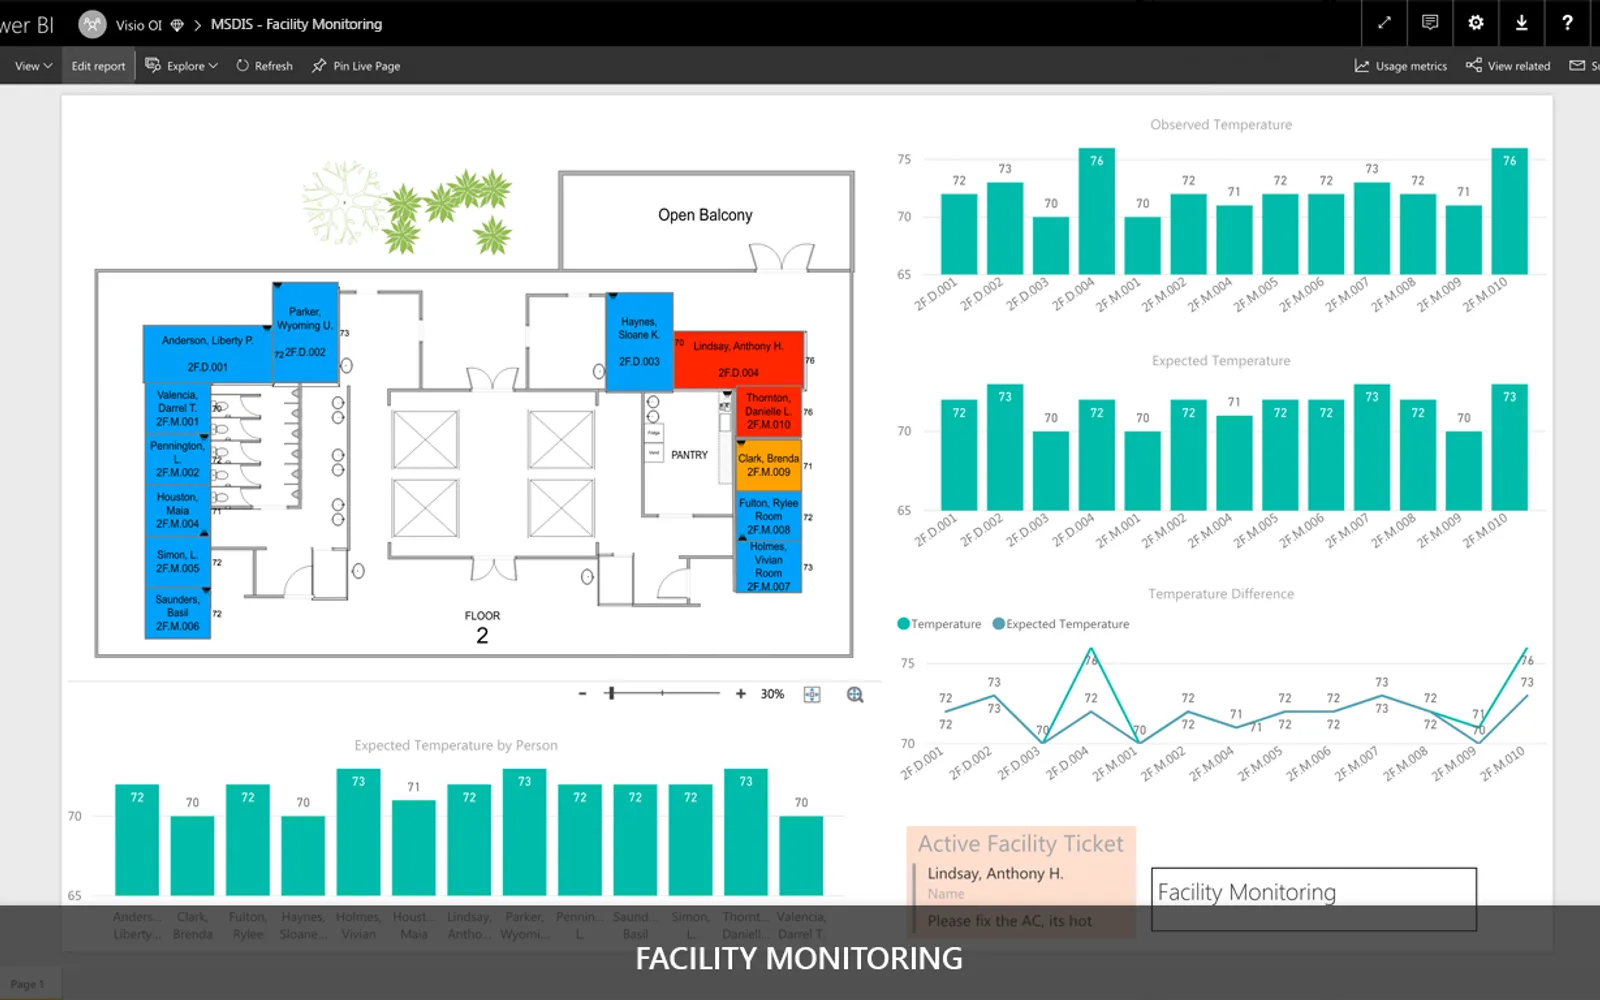
Visio Visual brings Visio diagrams into Power BI from SharePoint Online or OneDrive for Business. It associates report data with diagram shapes through shape properties or manual mapping. Values can appear through color ranges or text placed over the diagram. Selecting diagram elements can filter other report visuals, and filtered views can trigger diagram zoom when enabled.
Imports Visio diagrams such as flowcharts, BPMN diagrams, floor plans, organization charts, networks, timelines, electrical diagrams, rack diagrams, and value stream maps.
Links report data to diagram shapes by using shape properties.
Provides a way to connect report data from within the visual.
Represents data on the diagram with color ranges for different states.
Shows report values as text over the diagram.
Can zoom into a filtered diagram area when the setting is turned on.
Uses diagram selections to filter other Power BI visuals.
Visio Visual and kml-kmz-visual are both paid cloud listings. Visio Visual was updated on Jun 2026, while kml-kmz-visual was updated on Feb 2026.
| Name | Pricing | Deployment | Updated |
|---|---|---|---|
| this plugin | Paid | Cloud | |
| kml-kmz-visual | Paid | Cloud |
965 plugins in Power BI · Analytics
Price distribution: 75 free, 115 freemium, 509 paid, 266 price not published
KML/KMZ Viewer renders points, lines, and polygons from KML and KMZ files on interactive maps within Power BI reports.
Abdalla Dabes
Gantt Chart is a project management visual for Microsoft Power BI that tracks schedules, milestones, and resource workloads.
ChartPad
Creates visualizations from diverse chart types, combines multiple charts on one canvas, and adds custom annotations and tooltips.
Akvelon
Creates financial and business reports in Power BI with automatic variance calculations, P&L logic, and drill-down (s5, s6).
Zebra BI«Visio Visual gives an ability to represent Power BI data just like how you want it. Do you wish to represent Power BI data on business process workflows or on a real-world layout like floor plan, industrial layout or on an organization chart or any illustration of your choice? Using Microsoft Visio, you can easily …»