
Gantt Chart
Gantt Chart is a project management visual for Microsoft Power BI that tracks schedules, milestones, and resource workloads.
ChartPadFree
Displays data distributions in Power BI with controls for comparing time periods and categories.
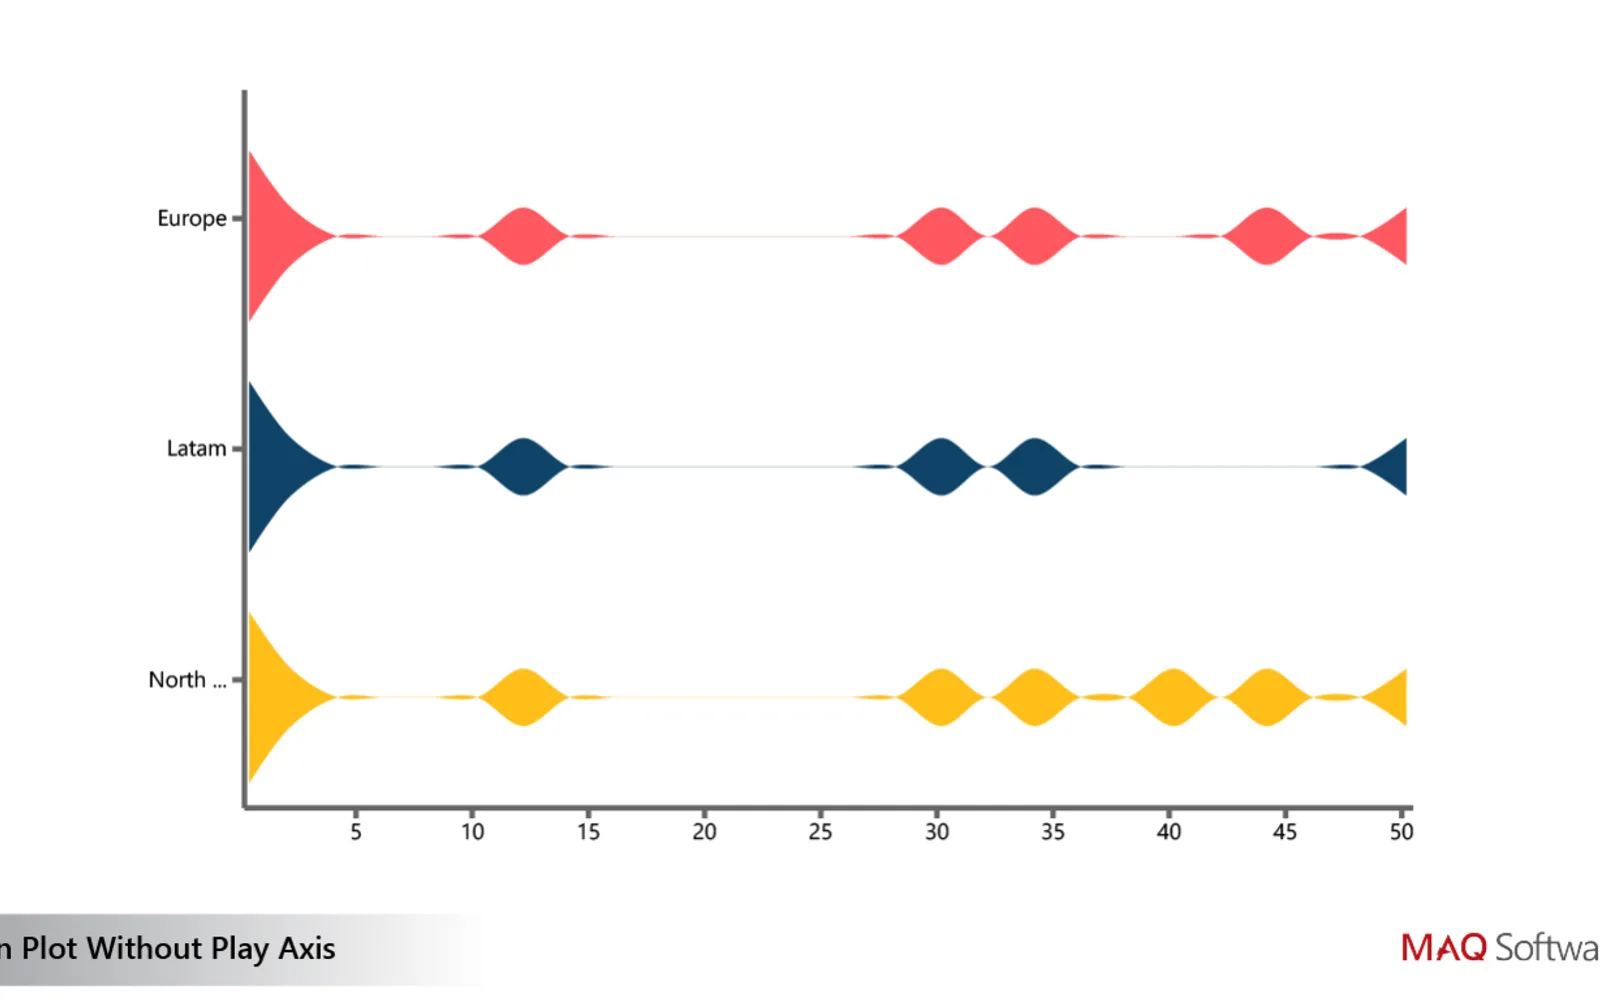
Displays distribution measures such as averages, variability, quartile spread, and density. A slider and playback controls change the view over time or between categories. The visual supports custom colors and filtering interactions with other visuals.
Displays averages, variability, quartile spread, and density measures for the plotted data.
Uses a slider to change the view across time or categories.
Provides play and pause controls for viewing changes over time or categories.
Allows the colors used for plotted data to be changed.
Supports cross-filtering with other visuals.
The vendor names project managers, sales and marketing teams, and human resources teams.
2,531 plugins in Power BI · Analytics
Price distribution: 125 free, 147 freemium, 1,350 paid, 909 price not published
Gantt Chart is a project management visual for Microsoft Power BI that tracks schedules, milestones, and resource workloads.
ChartPad
Creates visualizations from diverse chart types, combines multiple charts on one canvas, and adds custom annotations and tooltips.
Akvelon
Creates financial and business reports in Power BI with automatic variance calculations, P&L logic, and drill-down (s5, s6).
Zebra BI
AI analysis app for Dynamics 365 Business Central that provides customer KPIs, churn probability, and customer grouping.
Data Courage«Violin Plot by MAQ Software enables you to easily view the distribution of data, including mean, standard deviation, quartile deviation, and probability density. With the plot’s interactive slider and animated play/pause button, you can view and project trends across products, services, locations, and more.»