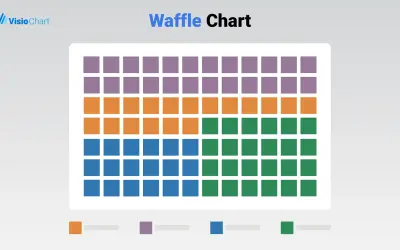
Waffle Chart Maker
Waffle Chart Maker renders grid-based charts from numbers or percentages with sorting and cross-filtering for Microsoft Power BI.
VisioChartFree
Adds editable text fields and justified paragraph formatting to Power BI reports.
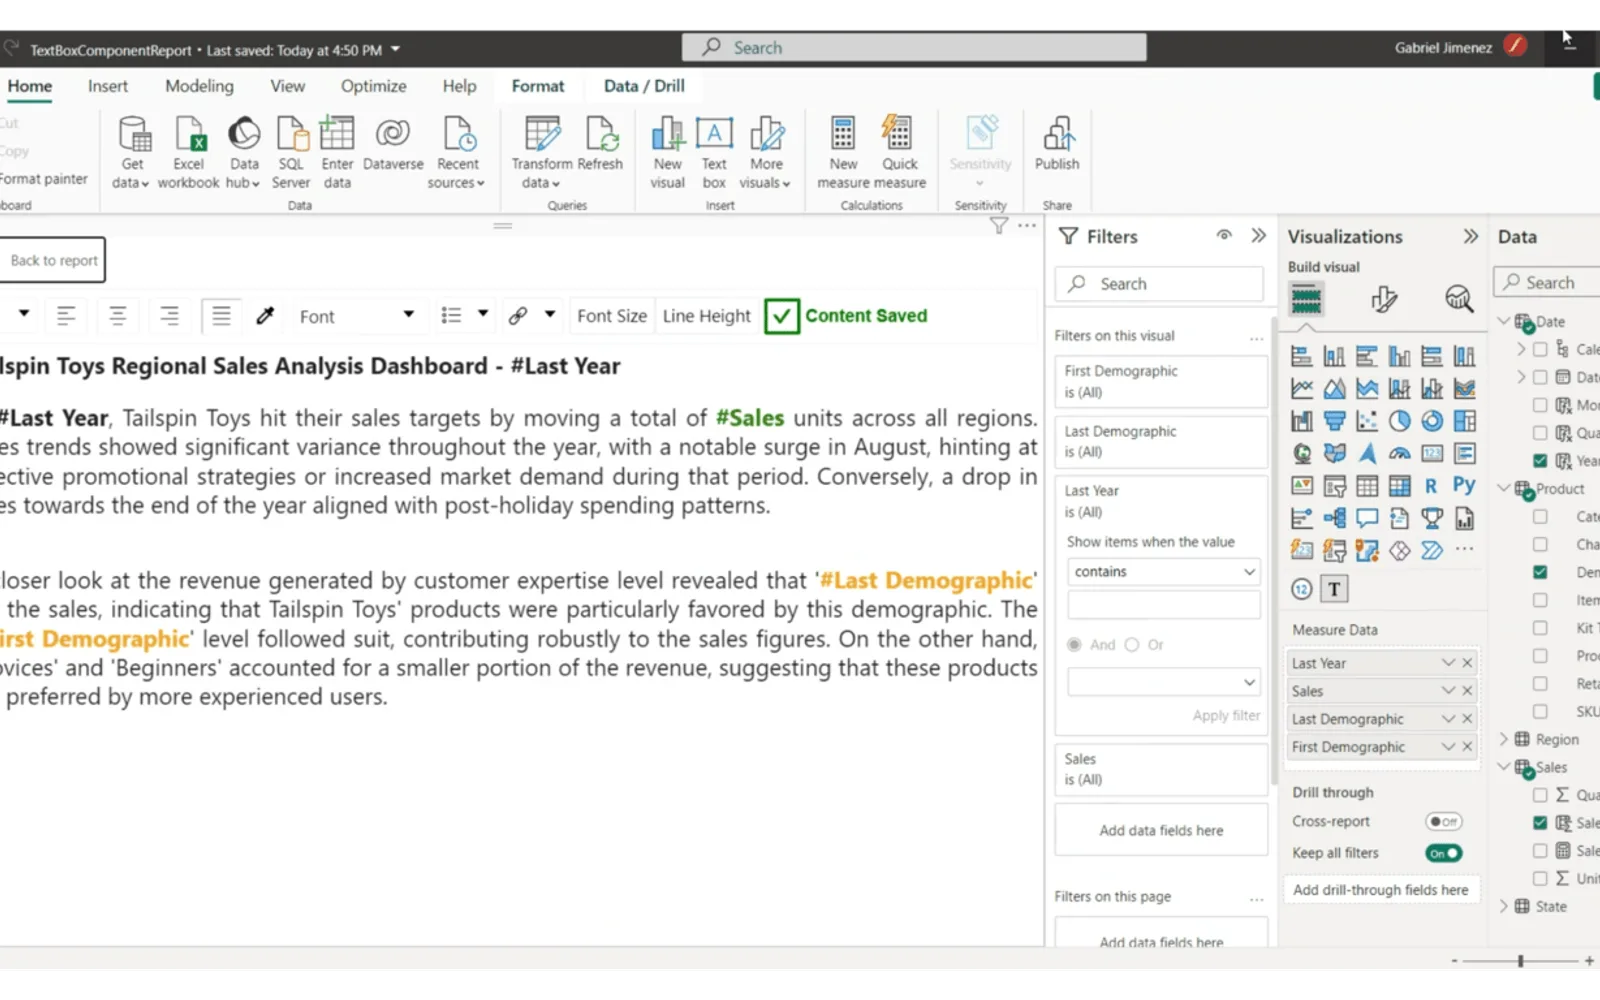
Adds an interactive field for entering text in Power BI reports. Text can be added beside visualizations for context, explanations, or annotations. The visual supports full paragraph justification in addition to left, center, and right alignment. It also supports descriptive text within reports for data narration.
Provides an interactive field for entering textual data in Power BI reports.
Allows text to be placed alongside data visualizations as context, explanations, or annotations.
Supports full paragraph justification in addition to left, center, and right alignment.
Adds descriptive text directly to reports for data storytelling.
Named audiences include data analysts, report builders, business executives, and decision-makers.
Untap Text Box is a paid cloud add-in, while Waffle Chart Maker and Risk & Opportunity Matrix are free cloud add-ins. Wordlit is also paid and cloud-based. Untap Text Box was updated on May 2024, compared with Dec 2025 for Waffle Chart Maker and Wordlit and May 2026 for Risk & Opportunity Matrix.
| Name | Pricing | Deployment | Updated |
|---|---|---|---|
| this plugin | Paid | Cloud | |
| Waffle Chart Maker | Free | Cloud | |
| Risk & Opportunity Matrix | Free | Cloud | |
| Wordlit | Paid | Cloud |
657 plugins in Power BI · Analytics
Price distribution: 73 free, 108 freemium, 441 paid, 35 price not published
Waffle Chart Maker renders grid-based charts from numbers or percentages with sorting and cross-filtering for Microsoft Power BI.
VisioChart
Power BI custom visual that shows downside risks and upside opportunities in one interface with pre- and post-mitigation states.
Cilver
Visualizes NLP text analysis as customizable knowledge graphs showing how words and concepts interrelate, for Streamlit.
Sahir Maharaj
Gantt Chart is a project management visual for Microsoft Power BI that tracks schedules, milestones, and resource workloads.
ChartPad«Untap Text Box is an innovative and interactive Power BI visual tool developed by Untap, designed to transform how users interact with and interpret data within Power BI reports. It introduces an interactive input field for textual data, enhancing the analytical and reporting capabilities of Power BI users. Value …»