
Gantt Chart
Gantt Chart is a project management visual for Microsoft Power BI that tracks schedules, milestones, and resource workloads.
ChartPadFree
Track portfolios and financial results, manage ESG activities, and prepare investor reports in Power BI.
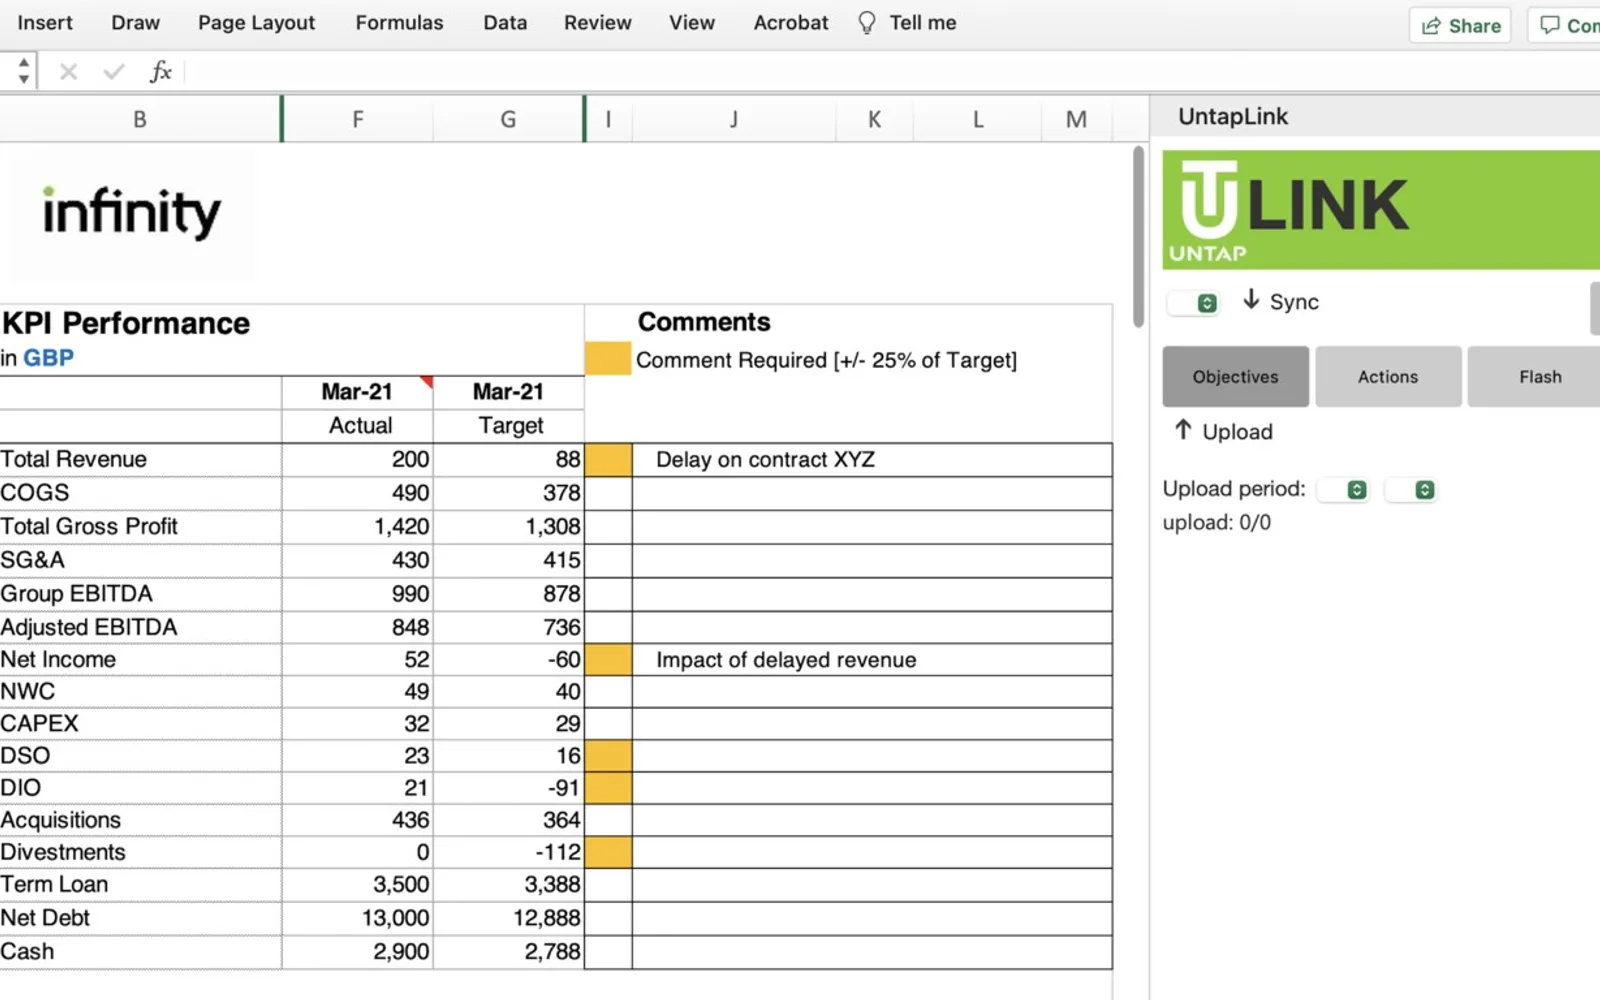
Untap combines portfolio oversight, financial result tracking, investor reports, value creation, and ESG activities in Power BI. It is intended for middle-office work at private equity and venture capital funds.
Monitors portfolio information.
Records and tracks financial performance.
Supports the preparation of reports for investors.
Includes value creation management.
Includes management of environmental, social, and governance activities.
Private equity and venture capital funds.
2,531 plugins in Power BI · Analytics
Price distribution: 125 free, 147 freemium, 1,350 paid, 909 price not published
Gantt Chart is a project management visual for Microsoft Power BI that tracks schedules, milestones, and resource workloads.
ChartPad
Creates visualizations from diverse chart types, combines multiple charts on one canvas, and adds custom annotations and tooltips.
Akvelon
Creates financial and business reports in Power BI with automatic variance calculations, P&L logic, and drill-down (s5, s6).
Zebra BI
AI analysis app for Dynamics 365 Business Central that provides customer KPIs, churn probability, and customer grouping.
Data Courage«Our solution is the first platform in the market that brings together portfolio monitoring and financial performance tracking, investor reporting, value creation, and ESG management. The solution is designed to streamline the middle office operations and maximize financial returns and the environmental impact of PE …»