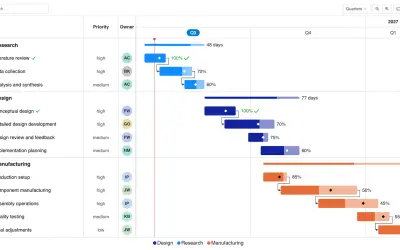
Gantt Chart
Gantt Chart is a project management visual for Microsoft Power BI that tracks schedules, milestones, and resource workloads.
ChartPadFree
Shows measure or category trends in a compact, configurable Power BI visual.
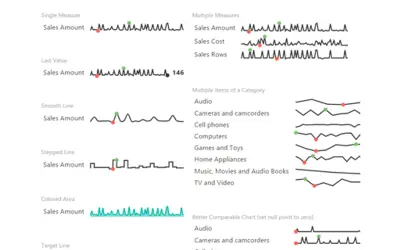
Presents trends for several measures or category items in a compact chart. The visual can mark extreme values, display the latest result, aggregate a series by sum or average, add target indicators, and adjust chart styling.
Marks the highest and lowest points in the displayed data.
Shows the final value from a series.
Supports sum and average views for a series.
Adds a target line or target area to the chart.
Allows changes to chart colors and line presentation.
2,531 plugins in Power BI · Analytics
Price distribution: 125 free, 147 freemium, 1,350 paid, 909 price not published
Gantt Chart is a project management visual for Microsoft Power BI that tracks schedules, milestones, and resource workloads.
ChartPad
Creates visualizations from diverse chart types, combines multiple charts on one canvas, and adds custom annotations and tooltips.
Akvelon
Creates financial and business reports in Power BI with automatic variance calculations, P&L logic, and drill-down (s5, s6).
Zebra BI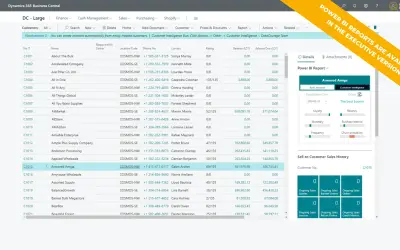
AI analysis app for Dynamics 365 Business Central that provides customer KPIs, churn probability, and customer grouping.
Data Courage«Sparkline by OKVIZ is a versatile visual that lets you display trends for multiple measures or category items in a compact, fully customizable format. Key Features • Highlighting the highest and lowest data points • Displaying the last value • Summing the series or showing the average • Adding a target line or area • …»