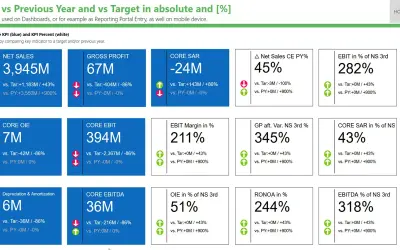
Ultimate KPI Card
Power BI custom visual that displays a measure with variance to a target and/or previous year in absolute and percentage terms.
dataviz.boutique GmbHPaid
Track KPIs in Power BI reports with this discontinued visual.
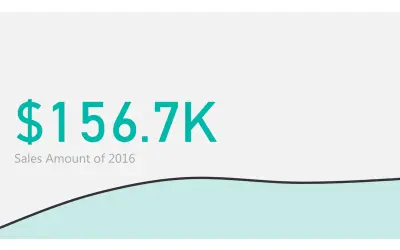
This Power BI visual presents KPI information through defined states. It is the original Card with States implementation. The listing marks it as deprecated and states that updates, bug fixes, and support have ended.
The visual represents KPI information with states in Power BI reports.
Both Card with States by OKVIZ (Legacy) and Ultimate KPI Card are paid cloud listings. Card with States by OKVIZ (Legacy) has an update date of May 2026, while Ultimate KPI Card has an update date of Feb 2026.
| Name | Pricing | Deployment | Updated |
|---|---|---|---|
| this plugin | Paid | Cloud | |
| Ultimate KPI Card | Paid | Cloud |
657 plugins in Power BI · Analytics
Price distribution: 73 free, 108 freemium, 441 paid, 35 price not published
Power BI custom visual that displays a measure with variance to a target and/or previous year in absolute and percentage terms.
dataviz.boutique GmbH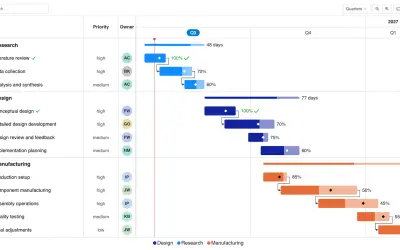
Gantt Chart is a project management visual for Microsoft Power BI that tracks schedules, milestones, and resource workloads.
ChartPad
Creates visualizations from diverse chart types, combines multiple charts on one canvas, and adds custom annotations and tooltips.
Akvelon
Creates financial and business reports in Power BI with automatic variance calculations, P&L logic, and drill-down (s5, s6).
Zebra BI«DEPRECATED This visual is now deprecated and will no longer receive updates, bug fixes, or support. NEW VERSION available: Card with States by OKVIZ About The Legacy Version This version represents the original implementation of Card with States, widely adopted for KPI monitoring in Power BI reports. Why upgrade? • …»