
Gantt Chart
Gantt Chart is a project management visual for Microsoft Power BI that tracks schedules, milestones, and resource workloads.
ChartPadFree
Analyzes process event data and visualizes process flows inside Power BI.
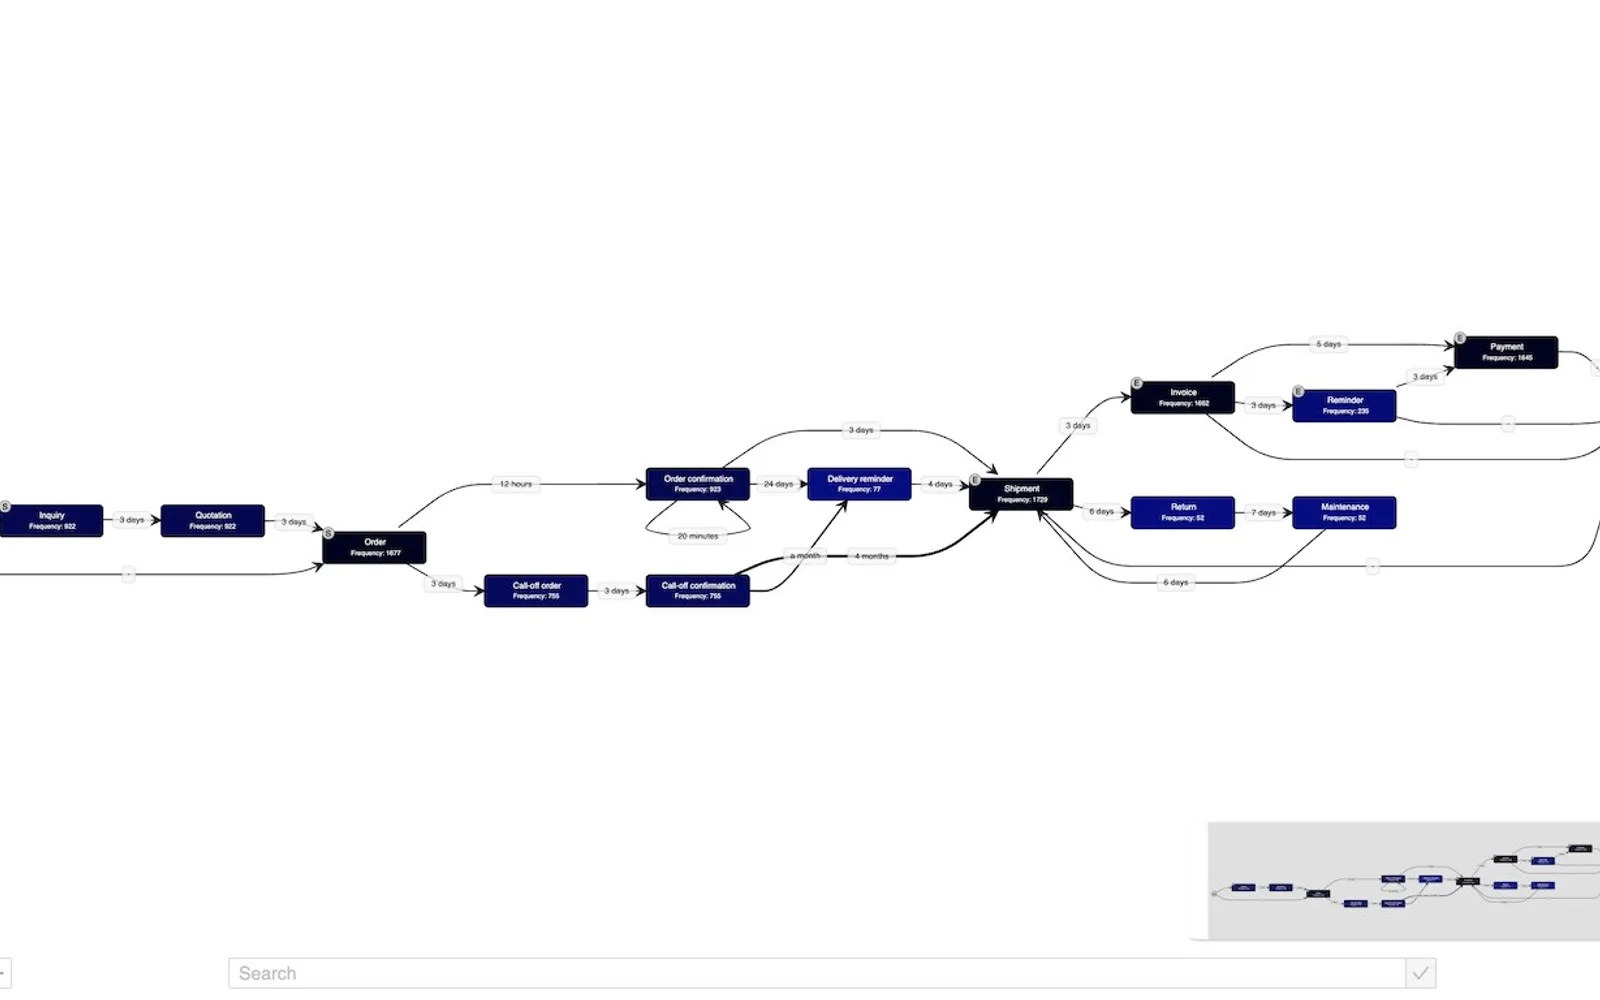
Process.Science turns event data into visual process flows in Microsoft Power BI. It shows process bottlenecks, variations, and steps associated with resource use. The trial includes process discovery and processes up to 1,000 event log rows. Pro adds swim lanes and support for up to 50,000 event log rows.
The trial includes a process analyzer for visual process discovery in Power BI.
The add-in transforms event data into visual process flows.
Process.Science shows where bottlenecks occur in a process.
The add-in identifies process variations associated with resource use.
Users can identify outliers by examining process data.
The add-in supports root cause analysis through deeper examination of process data.
657 plugins in Power BI · Analytics
Price distribution: 73 free, 108 freemium, 441 paid, 35 price not published
Gantt Chart is a project management visual for Microsoft Power BI that tracks schedules, milestones, and resource workloads.
ChartPad
Creates visualizations from diverse chart types, combines multiple charts on one canvas, and adds custom annotations and tooltips.
Akvelon
Creates financial and business reports in Power BI with automatic variance calculations, P&L logic, and drill-down (s5, s6).
Zebra BI
AI analysis app for Dynamics 365 Business Central that provides customer KPIs, churn probability, and customer grouping.
Data Courage«Companies usually work on a base of established, informal process structures. But without clear visibility into how processes actually unfold, inefficiencies remain hidden, costs pile up, and improvement efforts miss their mark. process mining changes this by transforming your event data into visual process flows …»