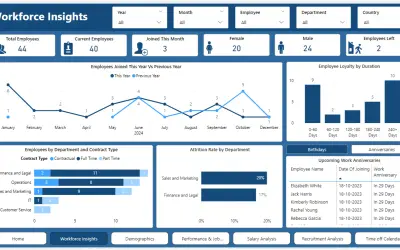
HR Reporting and Analytics- Power BI Dashboard
Power BI dashboard with real-time views of HR metrics such as headcount, attrition, recruitment, compensation, and leave.
Addend Analytics LLPPaid
Process mining in Power BI analyzes events, compares actual and target processes, and highlights divergences.
Process.Science analyzes organizational events to show actual processes and compare them with target processes in Power BI. Algorithms identify process divergences and highlight them, while events can be cross-filtered and outliers recognized. Process sequences are displayed in charts within the existing business intelligence architecture. The vendor states that data remains within existing security systems and that no software configuration is required.
Displays process sequences in charts for analysis.
Compares actual processes with target processes.
Uses algorithms to identify and highlight process divergences.
Allows individual events to be cross-filtered.
Recognizes outliers in process data.
Runs the Process.Science algorithms within Power BI.
The vendor names medium-sized companies as a target group.
Both Process.Science Process Mining and HR Reporting and Analytics- Power BI Dashboard are paid cloud listings. Process.Science Process Mining was updated on Dec 2025, while HR Reporting and Analytics- Power BI Dashboard was updated in Jul 2026. The Process.Science listing states process mining capabilities, while the alternative is named as an HR reporting and analytics dashboard.
| Name | Pricing | Deployment | Updated |
|---|---|---|---|
| this plugin | Paid | Cloud | |
| HR Reporting and Analytics- Power BI Dashboard | Paid | Cloud |
657 plugins in Power BI · Analytics
Price distribution: 73 free, 108 freemium, 441 paid, 35 price not published
Power BI dashboard with real-time views of HR metrics such as headcount, attrition, recruitment, compensation, and leave.
Addend Analytics LLP
Gantt Chart is a project management visual for Microsoft Power BI that tracks schedules, milestones, and resource workloads.
ChartPad
Creates visualizations from diverse chart types, combines multiple charts on one canvas, and adds custom annotations and tooltips.
Akvelon
Creates financial and business reports in Power BI with automatic variance calculations, P&L logic, and drill-down (s5, s6).
Zebra BI«Process.Science for Power BI. Visualize. Understand. Optimize. Process.Science for Power BI is a powerful Power BI integration that enables you to see your company from a perspective you never had before. It provides you with an overview of your real as-is-processes by analyzing all events in your organization …»