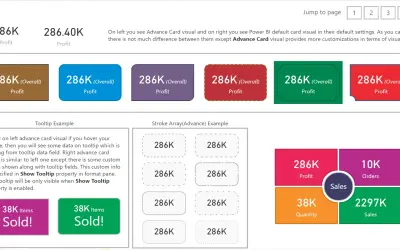
Advance Card
Custom card visual for Power BI that extends the default card with conditional formatting, tooltips, and alignment options.
Bhavesh JadavPaid
Show KPI measures, status markers, thresholds, and trends in Power BI.
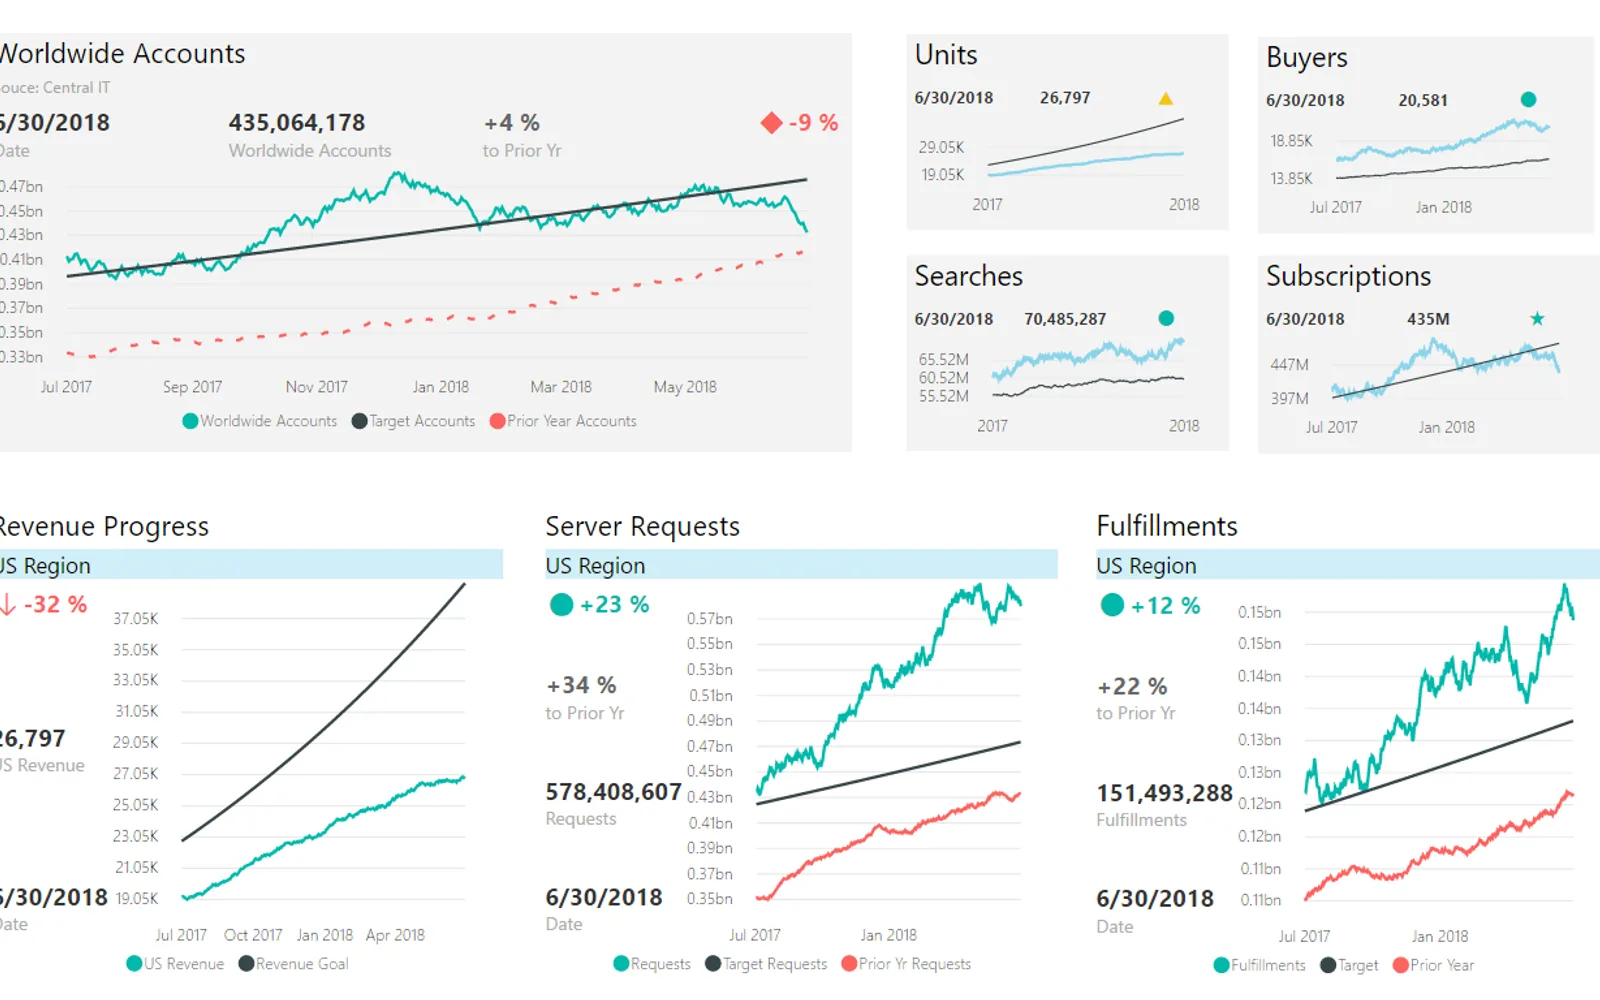
Presents KPI measures with status markers, variance, titles, subtitles, and a date. Provides controls for indicator shapes, colors, text, labels, tooltips, descriptions, and value placement. Adds a line chart with trend, forecast, comparison, reference, axis, and legend options. Thresholds can come from a model column or a calculated column.
Displays KPI measures with status markers, variance, titles, subtitles, and a date.
Provides multiple marker shapes and lets users assign custom colors.
Controls font sizes, text and background colors, labels, tooltips, alternate titles, and descriptions.
Shows or hides card values and places them on the top, bottom, left, or right.
Adds trend, forecast, and comparison lines with hover details, reference lines, axis controls, and legend placement.
Uses either a model column with symbol indexes or a calculated column for threshold values.
Adjusts report tiles when they are pinned to dashboards at different sizes.
Power KPI is paid and cloud-deployed, matching Advance Card and KPI Scorecard Report. Waffle Chart Maker is free, while Sunburst Chart and Bullet Chart - xViz are freemium; each listed alternative is cloud-deployed. Power KPI was updated in Jun 2026, while Advance Card was updated in Oct 2024, KPI Scorecard Report in Nov 2024, and the other three alternatives in Dec 2025.
| Name | Pricing | Deployment | Updated |
|---|---|---|---|
| this plugin | Paid | Cloud | |
| Advance Card | Paid | Cloud | |
| KPI Scorecard Report | Paid | Cloud | |
| Waffle Chart Maker | Free | Cloud | |
| Sunburst Chart | Freemium | Cloud | |
| Bullet Chart - xViz | Freemium | Cloud |
657 plugins in Power BI · Analytics
Price distribution: 73 free, 108 freemium, 441 paid, 35 price not published
Custom card visual for Power BI that extends the default card with conditional formatting, tooltips, and alignment options.
Bhavesh Jadav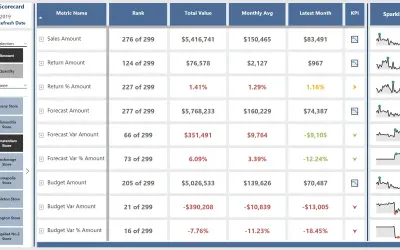
Lays out a grid of DAX measures across rows and columns using native and custom visuals to build a Power BI scorecard template.
Havens Consulting Inc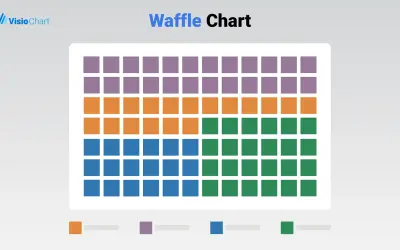
Waffle Chart Maker renders grid-based charts from numbers or percentages with sorting and cross-filtering for Microsoft Power BI.
VisioChart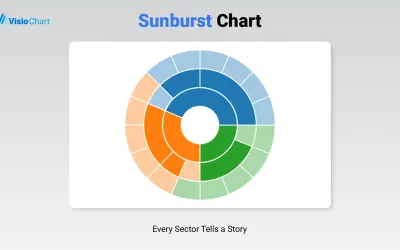
Displays up to five levels of hierarchical data as proportional segments across concentric rings in Power BI reports.
VisioChart«Power KPI is a versatile and highly customizable visual for Power BI, designed to display key performance indicators (KPIs) alongside contextual data and advanced formatting. It is ideal for dashboards that require both clarity and analytical depth. Key Capabilities • KPI Display: Present KPI value, status symbol, and …»