
Gantt Chart
Gantt Chart is a project management visual for Microsoft Power BI that tracks schedules, milestones, and resource workloads.
ChartPadFree
Edit JSON schemas for selected Power BI visuals, including Deneb, PlotlyJS, HTML/SVG/Handlebars, and Charticulator.
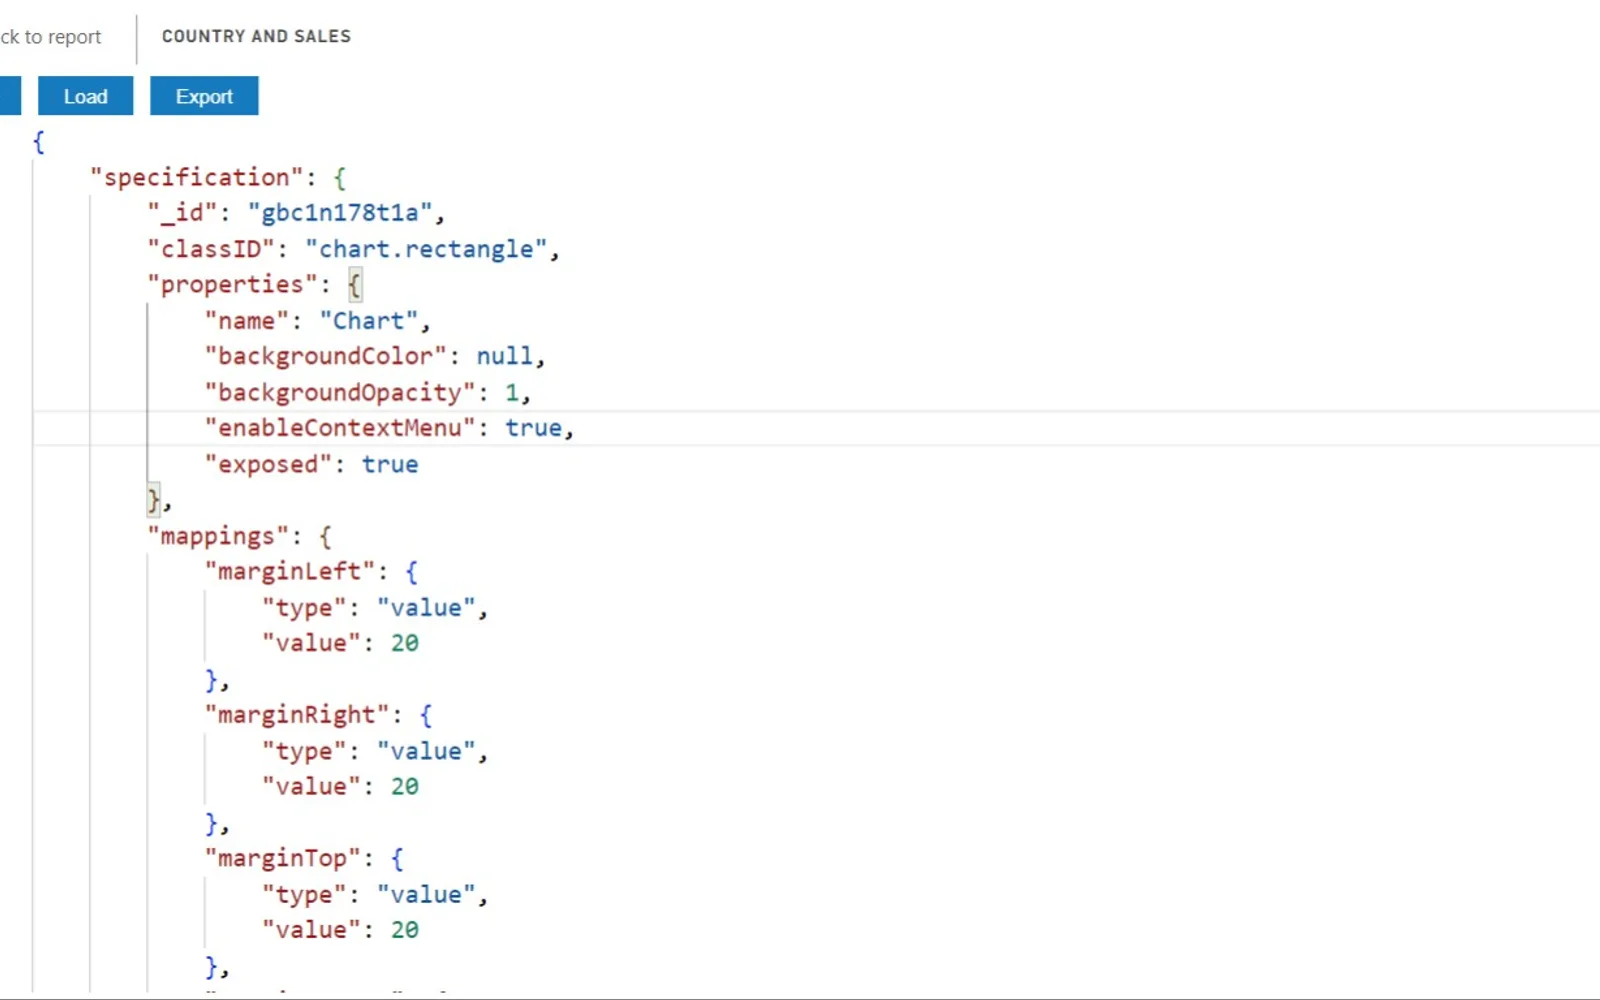
Power BI Visual Editor uses Monaco Editor and loads a JSON schema for autocomplete. It switches a selected visual to the editor and loads a schema based on the target visual setting. JSON changes modify the chart, and the Save button stores the schema. The visual can then be switched back to its previous type.
Provides the editing interface for visual JSON.
Loads a JSON schema to provide autocomplete while editing.
Loads a schema for Deneb, PlotlyJS, HTML/SVG/Handlebars, or Charticulator based on the selected target visual.
Applies JSON changes to modify the chart in the visual.
Saves the edited schema when the Save button is clicked.
657 plugins in Power BI · Analytics
Price distribution: 73 free, 108 freemium, 441 paid, 35 price not published
Gantt Chart is a project management visual for Microsoft Power BI that tracks schedules, milestones, and resource workloads.
ChartPad
Creates visualizations from diverse chart types, combines multiple charts on one canvas, and adds custom annotations and tooltips.
Akvelon
Creates financial and business reports in Power BI with automatic variance calculations, P&L logic, and drill-down (s5, s6).
Zebra BI
AI analysis app for Dynamics 365 Business Central that provides customer KPIs, churn probability, and customer grouping.
Data Courage«The visual powered by Monaco Editor and loads JSON schema to provide autocomplete. Select one of the visual (Deneb, PlotlyJS, HTML/SVG/Handlebars, Charticulator) on the report. Don't create the new instance of the Power BI Visual Editor. Switch the selected visual to 'Power BI Visual Editor'. The current seleccted …»