
Gantt Chart
Gantt Chart is a project management visual for Microsoft Power BI that tracks schedules, milestones, and resource workloads.
ChartPadFree
Automates recurring Power BI dashboard and report captures, delivering images, PDFs, or Excel files to recipients and destinations.
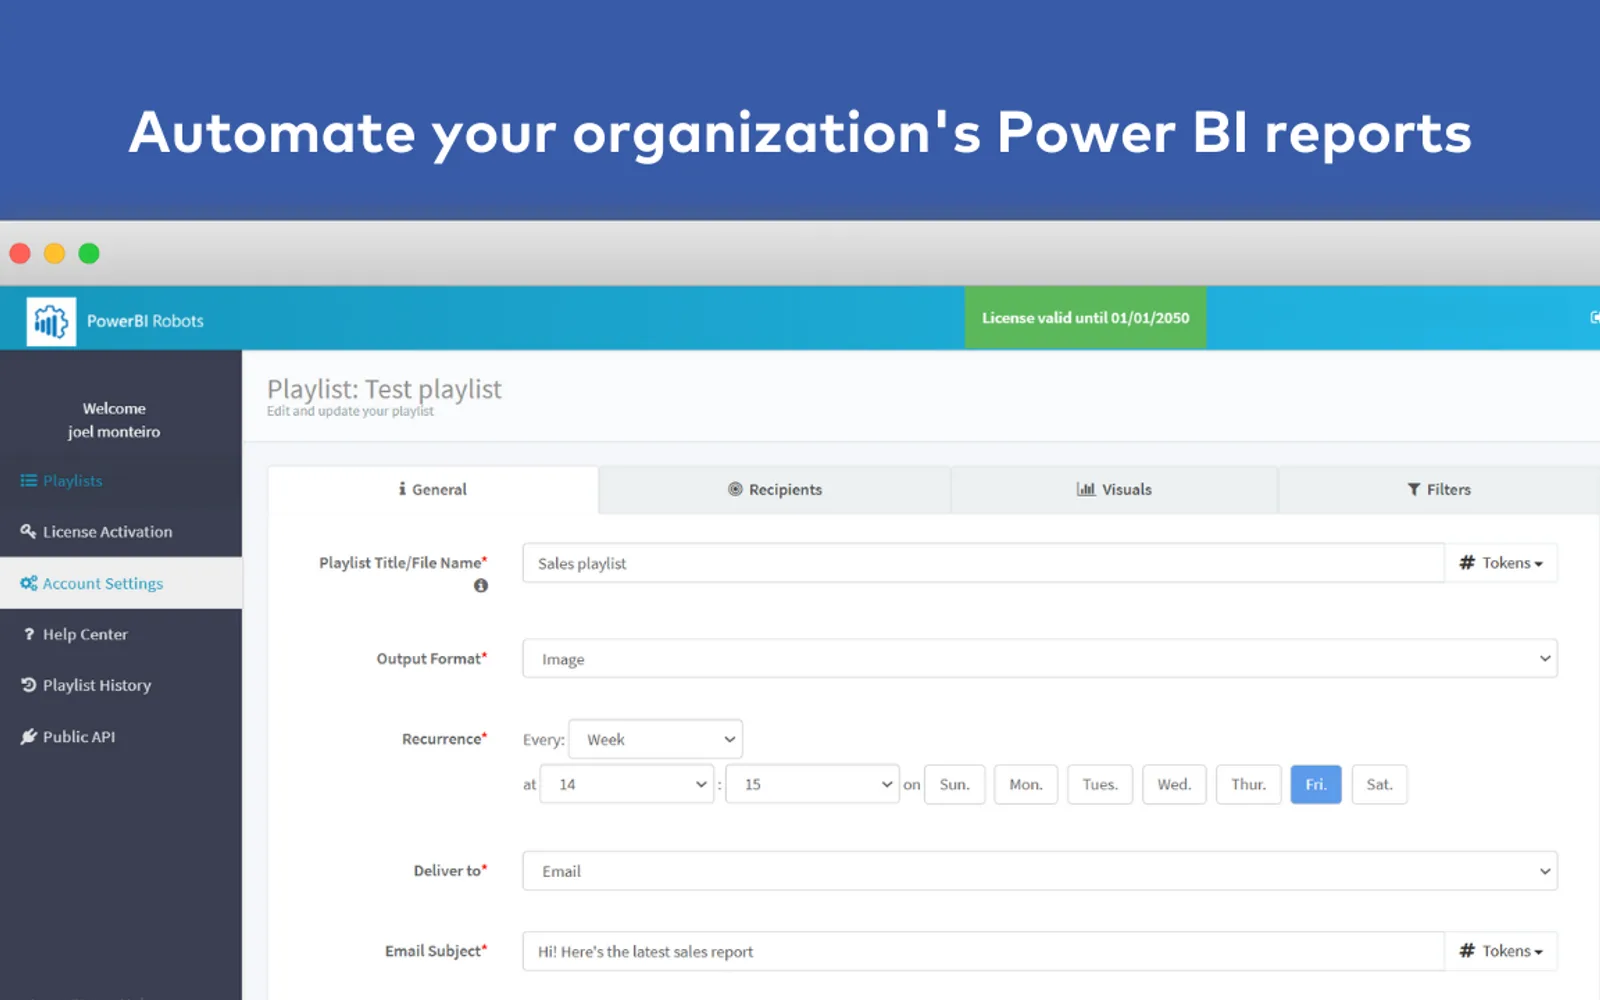
PowerBI Robots takes recurring screenshots of Microsoft Power BI dashboards and reports using robotic process automation. It saves captures as images, PDFs, or Excel files and sends them by email, to a SharePoint library, to a file system, or through a generated URL. The free version has no stated usage limits but adds a red watermark to images and PDFs; an annual license removes the watermark.
Takes screenshots of Power BI dashboards and reports on a recurring basis.
Saves captured data as an image, PDF, or Excel file.
Sends captured files to any number of recipients by email.
Sends captured files to a SharePoint library.
Sends captured files to a file system.
Provides captured data through a generated URL.
53 plugins in Power BI · Automation
Price distribution: 1 free, 15 paid, 37 price not published
Gantt Chart is a project management visual for Microsoft Power BI that tracks schedules, milestones, and resource workloads.
ChartPad
Creates visualizations from diverse chart types, combines multiple charts on one canvas, and adds custom annotations and tooltips.
Akvelon
Creates financial and business reports in Power BI with automatic variance calculations, P&L logic, and drill-down (s5, s6).
Zebra BI
AI analysis app for Dynamics 365 Business Central that provides customer KPIs, churn probability, and customer grouping.
Data Courage«PowerBI Robots is a tool for Microsoft® Power BI™ that uses Robot Process Automation (RPA) to automatically and recurrently take screenshots of dashboards and reports and deliver them to any number of recipients. The data are saved as an image or PDF or Excel file and instantly sent to an email, a SharePoint™ library …»