
Gantt Chart
Gantt Chart is a project management visual for Microsoft Power BI that tracks schedules, milestones, and resource workloads.
ChartPadFree
Imports Officient personnel and payroll information into Power BI for workforce and HR reporting.
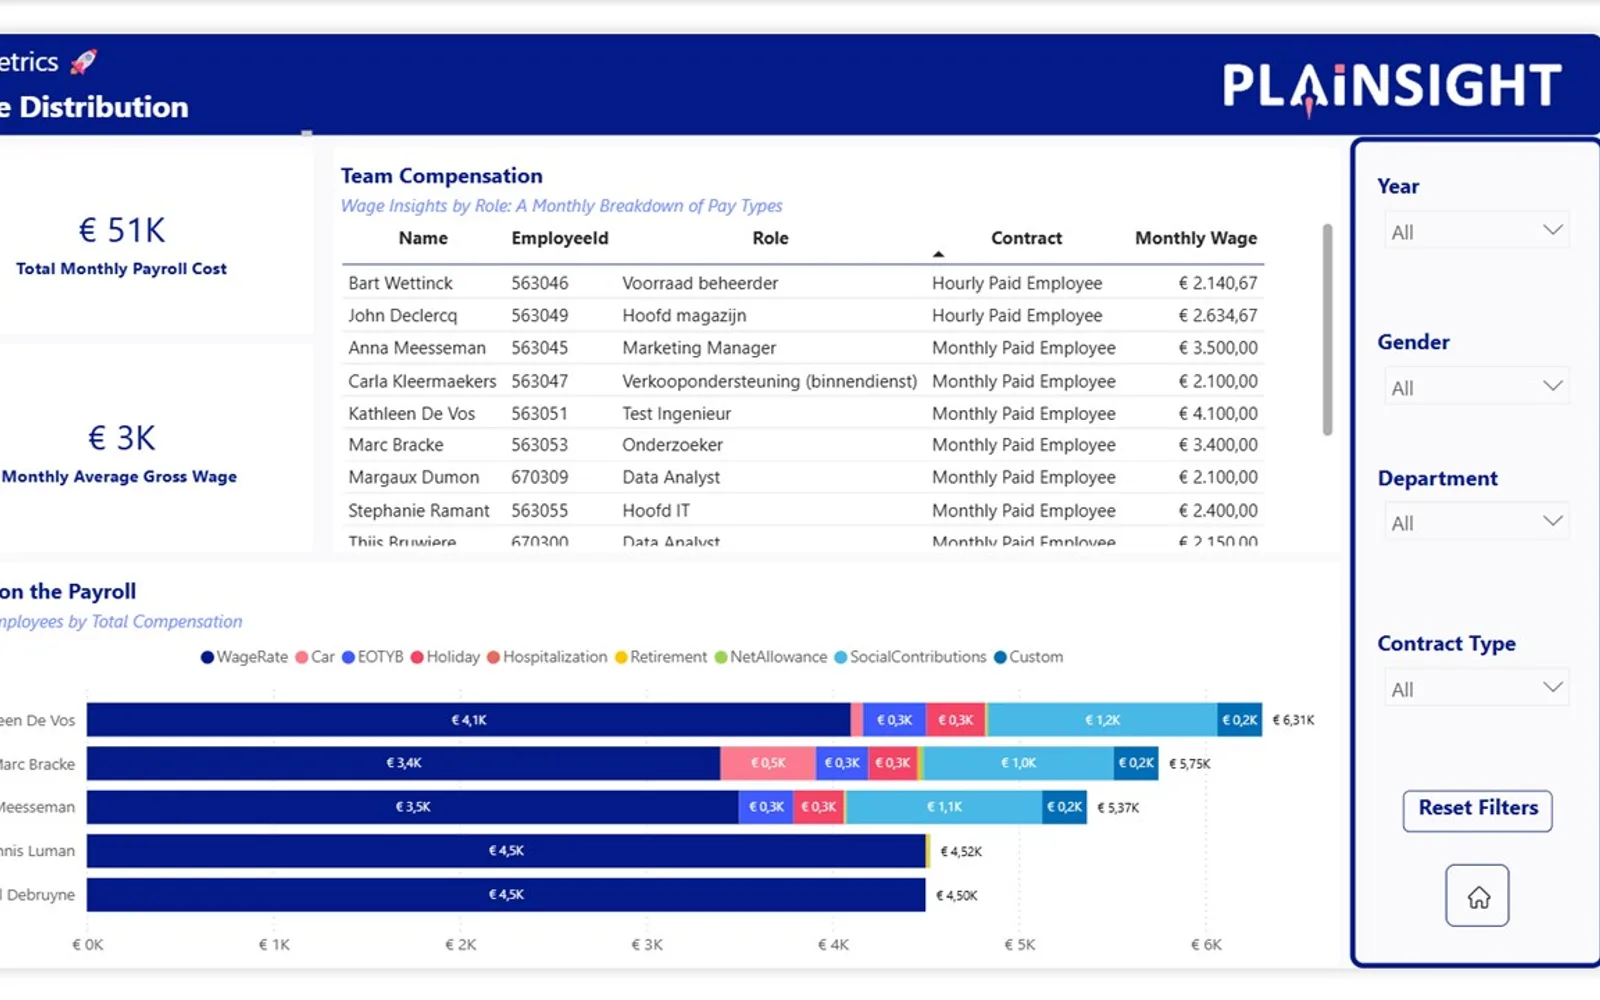
Moves personnel and payroll information from Officient into Power BI. Available data includes employee information, pay details, absence records, contracts, and other HR measures. The imported data can be used to build customizable Power BI dashboards for workforce, personnel cost, and HR reporting.
Brings employee information from Officient into Power BI.
Brings pay-related data from Officient into Power BI.
Includes absence records in the data transferred to Power BI.
Includes contract information from Officient for Power BI reporting.
Transfers other personnel measures from Officient into Power BI.
Supports customizable dashboards based on the transferred Officient data.
15 plugins in Power BI · HR
Price distribution: 11 paid, 4 price not published
Gantt Chart is a project management visual for Microsoft Power BI that tracks schedules, milestones, and resource workloads.
ChartPad
Creates visualizations from diverse chart types, combines multiple charts on one canvas, and adds custom annotations and tooltips.
Akvelon
Creates financial and business reports in Power BI with automatic variance calculations, P&L logic, and drill-down (s5, s6).
Zebra BI
AI analysis app for Dynamics 365 Business Central that provides customer KPIs, churn probability, and customer grouping.
Data Courage«This Power BI app integrates two powerful tools—Officient and Power BI. It extracts HR and payroll-related data from Officient, such as employee records, wage details, absences, contracts, and other personnel metrics, and feeds this data into Power BI. This integration enables the creation of dynamic, customizable …»