
Gantt Chart
Gantt Chart is a project management visual for Microsoft Power BI that tracks schedules, milestones, and resource workloads.
ChartPadFree
Documents Power BI indicators, dimensions, metadata, and their analysis relationships.
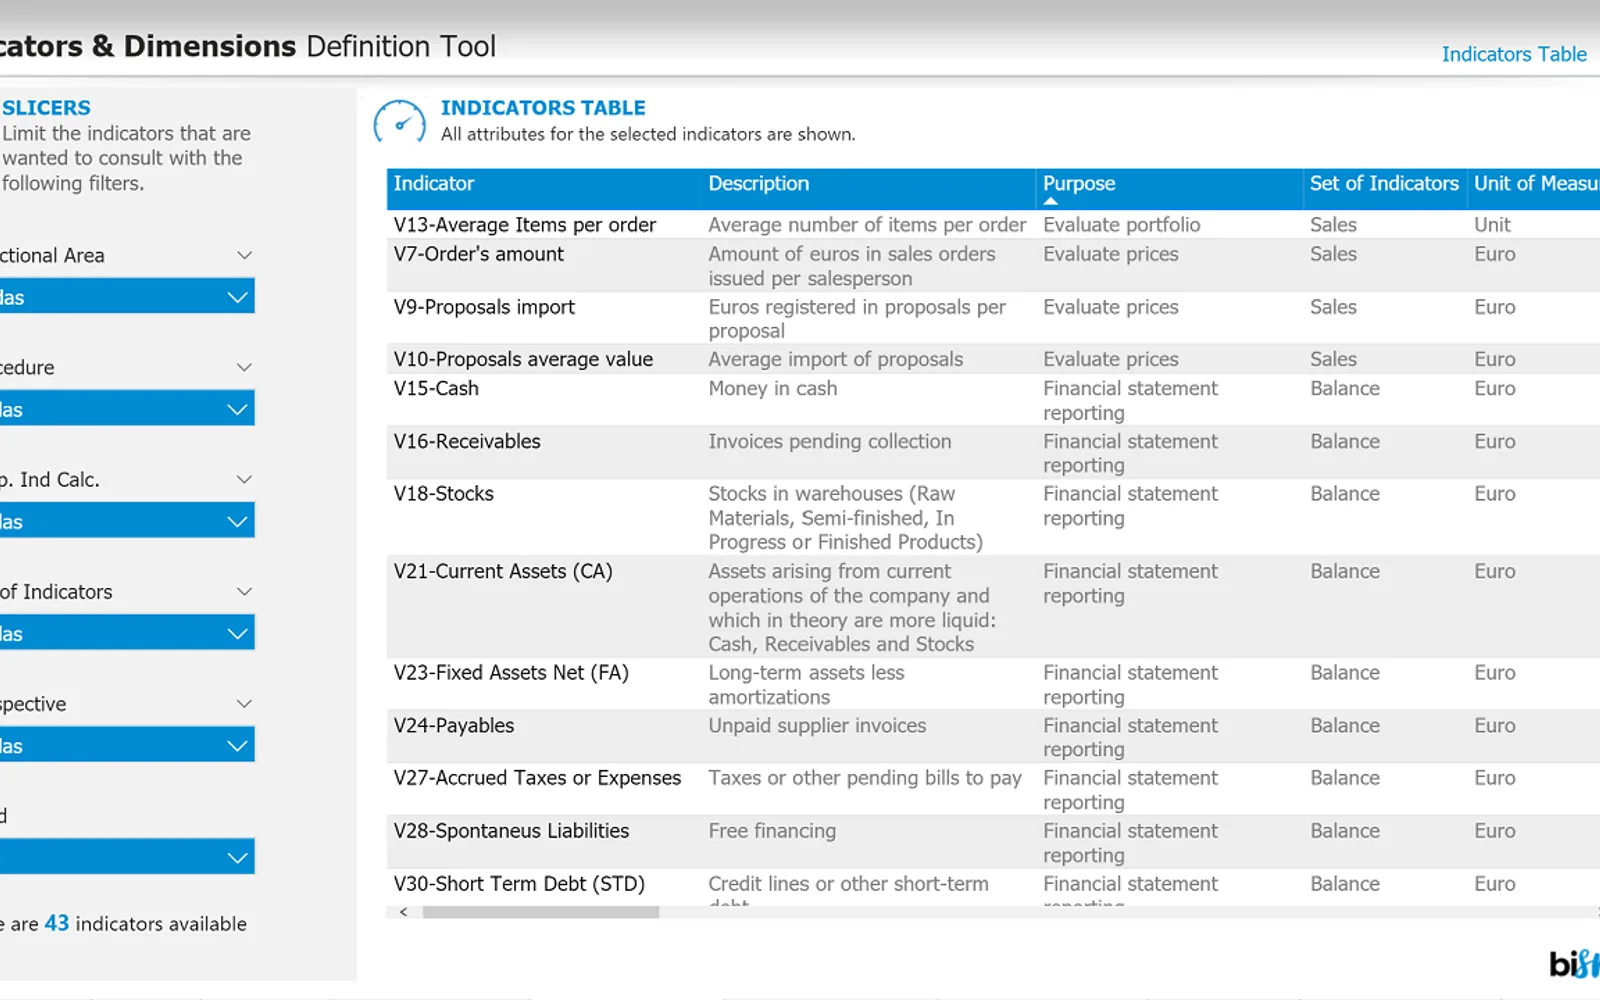
Provides indicator cards with functional and technical metadata, including descriptions, purposes, calculation methods, responsible parties, and data origins. Dimension sheets list the dimensions used to analyse each indicator, with hierarchical levels, level attributes, and source details. A bus matrix displays relationships between indicators and dimensions by indicator group, indicator, or dimension.
Records functional and technical metadata for indicators, including names, descriptions, purposes, calculation methods, display order, functional areas, responsible parties, and data origins.
Lists the dimensions associated with each indicator, including hierarchical levels, level attributes, source systems, and detail systems.
Displays relationships between indicators and dimensions in graphical or tabular form.
Provides filtered access to indicator information on screen.
Functional users and IT users.
2,531 plugins in Power BI · Analytics
Price distribution: 125 free, 147 freemium, 1,350 paid, 909 price not published
Gantt Chart is a project management visual for Microsoft Power BI that tracks schedules, milestones, and resource workloads.
ChartPad
Creates visualizations from diverse chart types, combines multiple charts on one canvas, and adds custom annotations and tooltips.
Akvelon
Creates financial and business reports in Power BI with automatic variance calculations, P&L logic, and drill-down (s5, s6).
Zebra BI
AI analysis app for Dynamics 365 Business Central that provides customer KPIs, churn probability, and customer grouping.
Data Courage«Indicators & Dimensions Definition Tool covers one of the main gaps that exist in the vast majority of organizations. To have an environment where both functional and IT users can consult in an agile and simple way what indicators and dimensions they have as well as their metadata thanks to the Indicators and …»