
Gantt Chart
Gantt Chart is a project management visual for Microsoft Power BI that tracks schedules, milestones, and resource workloads.
ChartPadFree
Data tagging and search for structured, semi-structured, and unstructured data in Power BI.
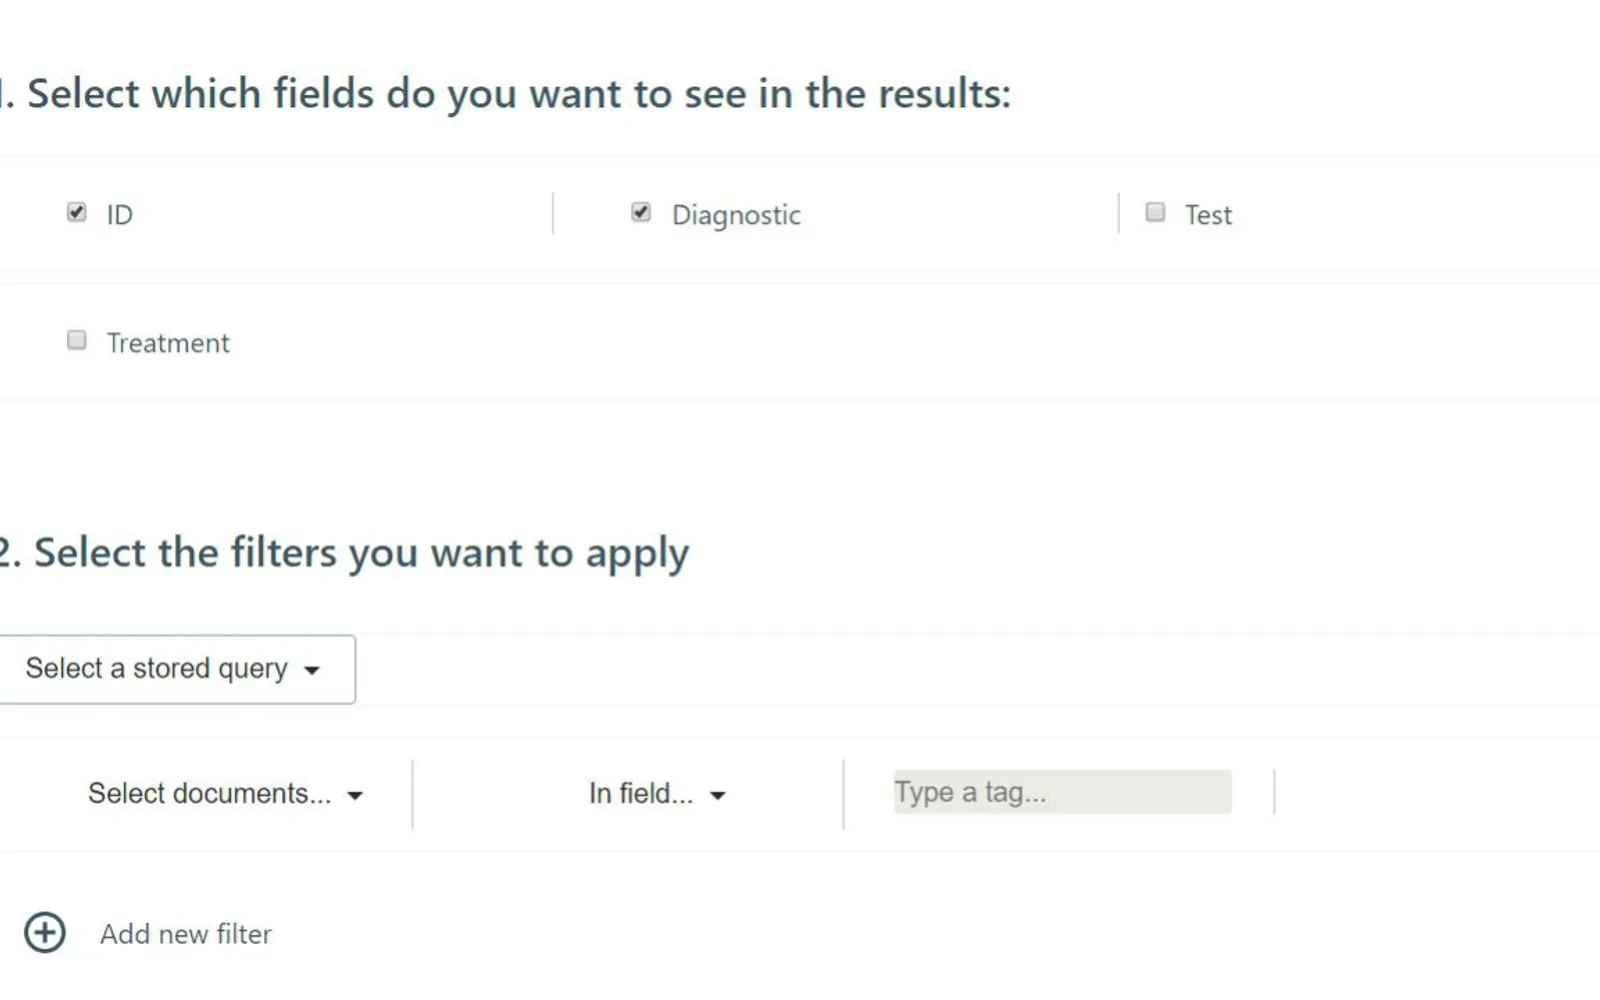
Folksonomy applies tags to structured, semi-structured, and unstructured data. Its algorithms identify repeated items and variations of the same item when creating tags. Tagged data can be searched, and tags can be restructured in real time for different uses. The add-in is based on Microsoft Azure cognitive services.
Applies tags to structured, semi-structured, and unstructured data.
Scans for differing variations of the same item when creating tags.
Provides a search engine for finding information in tagged data.
Restructures tags in real time for different uses.
Healthcare professionals, managers, and researchers.
493 plugins in Power BI · Data Management
Price distribution: 6 free, 6 freemium, 167 paid, 314 price not published
Gantt Chart is a project management visual for Microsoft Power BI that tracks schedules, milestones, and resource workloads.
ChartPad
Creates visualizations from diverse chart types, combines multiple charts on one canvas, and adds custom annotations and tooltips.
Akvelon
Creates financial and business reports in Power BI with automatic variance calculations, P&L logic, and drill-down (s5, s6).
Zebra BI
AI analysis app for Dynamics 365 Business Central that provides customer KPIs, churn probability, and customer grouping.
Data Courage«Folksonomy is a next-generation tagging system that allows to mine data sets and instantly gives the information you’re looking for. Bismart Folksonomy is based on Microsoft Azure's cognitive services. With massive archives of structured, semi-structured, or unstructured data, our folksonomy system applies intelligent …»