
Gantt Chart
Gantt Chart is a project management visual for Microsoft Power BI that tracks schedules, milestones, and resource workloads.
ChartPadFree
Refreshes data and visuals repeatedly in Power BI reports.
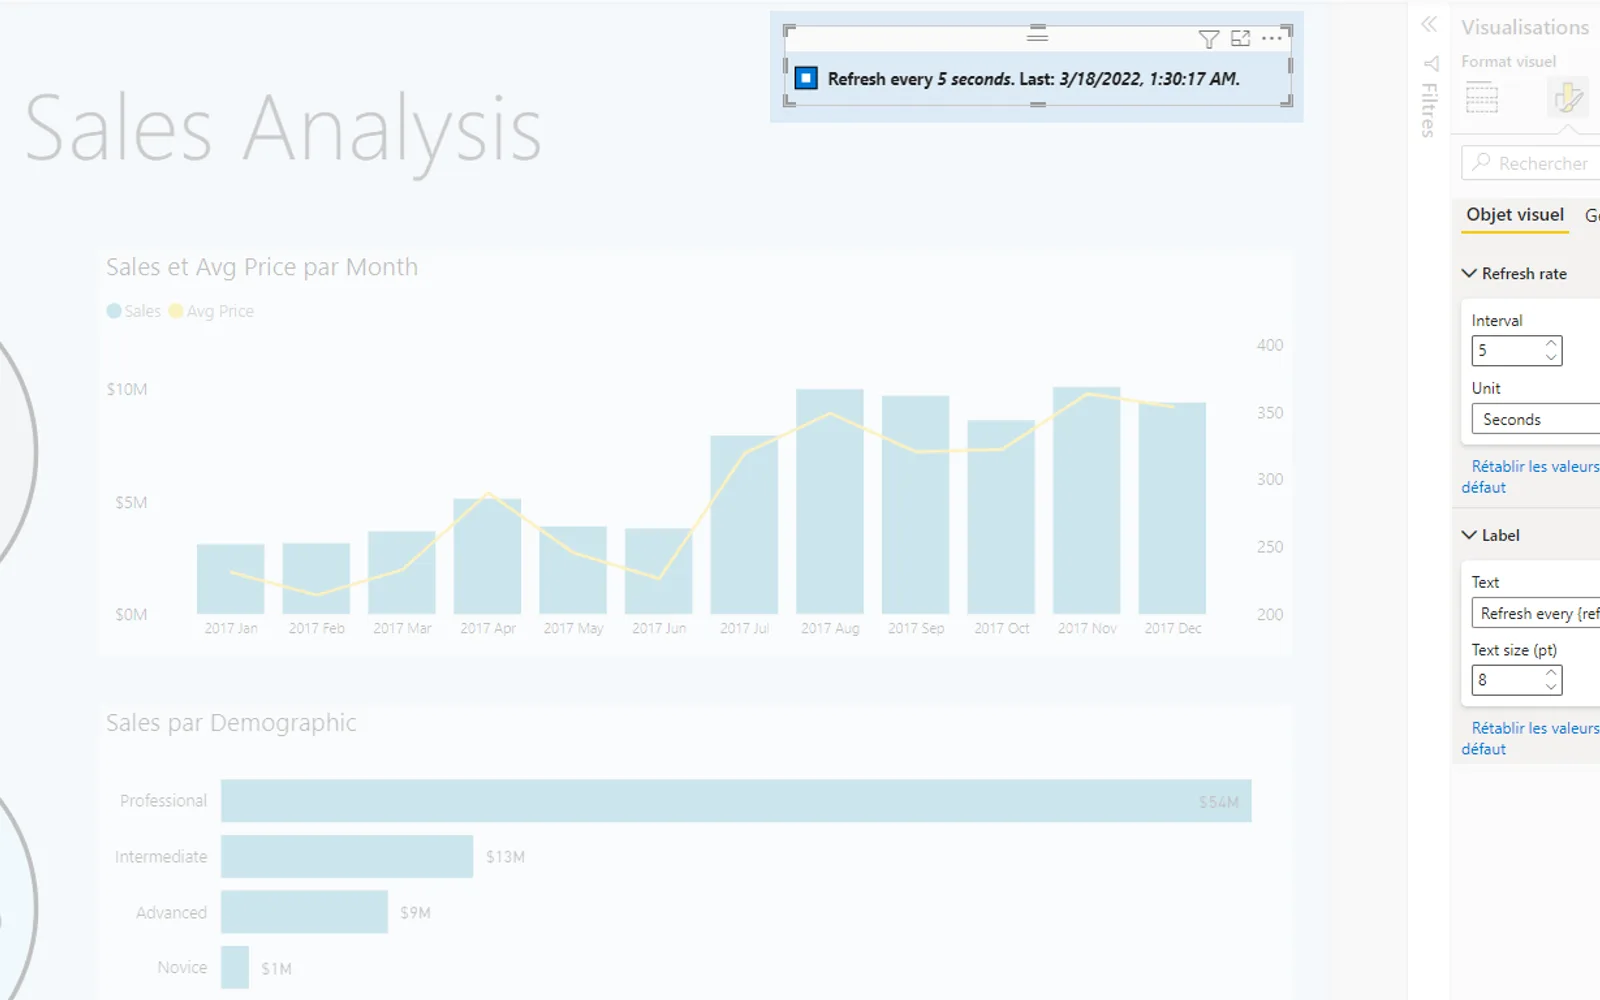
The Data Refresher visual repeatedly updates data and other visuals in reports. It is intended for dashboards displayed on TV screens without input devices, showing the latest data.
Repeatedly updates data in reports.
Updates other visuals along with the data.
2,531 plugins in Power BI · Analytics
Price distribution: 125 free, 147 freemium, 1,350 paid, 909 price not published
Gantt Chart is a project management visual for Microsoft Power BI that tracks schedules, milestones, and resource workloads.
ChartPad
Creates visualizations from diverse chart types, combines multiple charts on one canvas, and adds custom annotations and tooltips.
Akvelon
Creates financial and business reports in Power BI with automatic variance calculations, P&L logic, and drill-down (s5, s6).
Zebra BI
AI analysis app for Dynamics 365 Business Central that provides customer KPIs, churn probability, and customer grouping.
Data Courage«Use the Data Refresher visual on your reports to repeatedly update the data and the other visuals. It is particularly useful when you display your dashboard on a TV screen without input devices and you want to see the latest fresh data.»