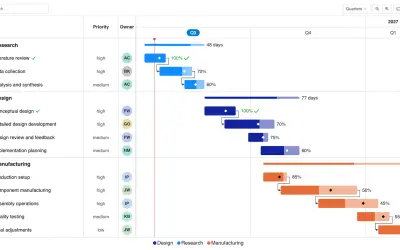
Gantt Chart
Gantt Chart is a project management visual for Microsoft Power BI that tracks schedules, milestones, and resource workloads.
ChartPadFree
Analyzes Azure Cognitive Search logs and metrics in Power BI.
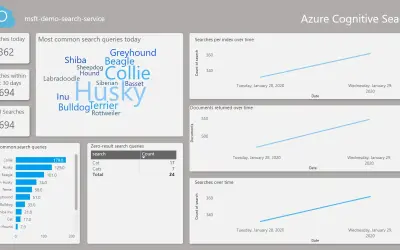
This Power BI app analyzes Azure Cognitive Search operation logs and service metrics. It provides information about search, indexing, operations, and service metrics.
Analyzes Azure Cognitive Search operation logs stored in an Azure Storage account.
Analyzes Azure Cognitive Search service metrics.
Provides information about Search.
Provides information about Indexing.
Provides information about Operations.
Developers building web, mobile, and enterprise applications.
657 plugins in Power BI · Analytics
Price distribution: 73 free, 108 freemium, 441 paid, 35 price not published
Gantt Chart is a project management visual for Microsoft Power BI that tracks schedules, milestones, and resource workloads.
ChartPad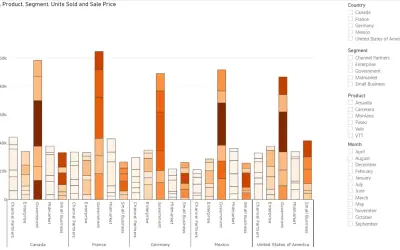
Creates visualizations from diverse chart types, combines multiple charts on one canvas, and adds custom annotations and tooltips.
Akvelon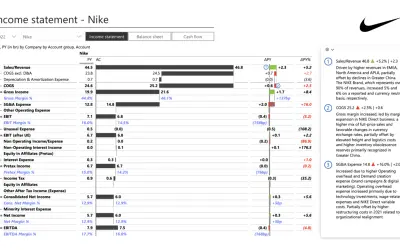
Creates financial and business reports in Power BI with automatic variance calculations, P&L logic, and drill-down (s5, s6).
Zebra BI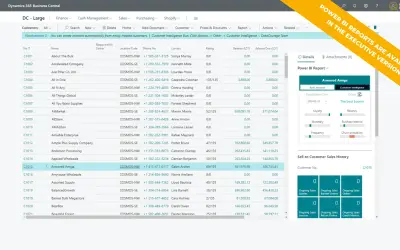
AI analysis app for Dynamics 365 Business Central that provides customer KPIs, churn probability, and customer grouping.
Data Courage«Azure Cognitive Search is a search-as-a-service cloud solution that gives developers APIs and tools for adding a rich search experience over private, heterogeneous content in web, mobile, and enterprise applications. Azure Cognitive Search allows you to store operation logs and service metrics in an Azure Storage …»