
Power Plot Visual by Akvelon
Creates visualizations from diverse chart types, combines multiple charts on one canvas, and adds custom annotations and tooltips.
AkvelonFreemium
Visualize selected data by hearing higher numbers as higher pitches.
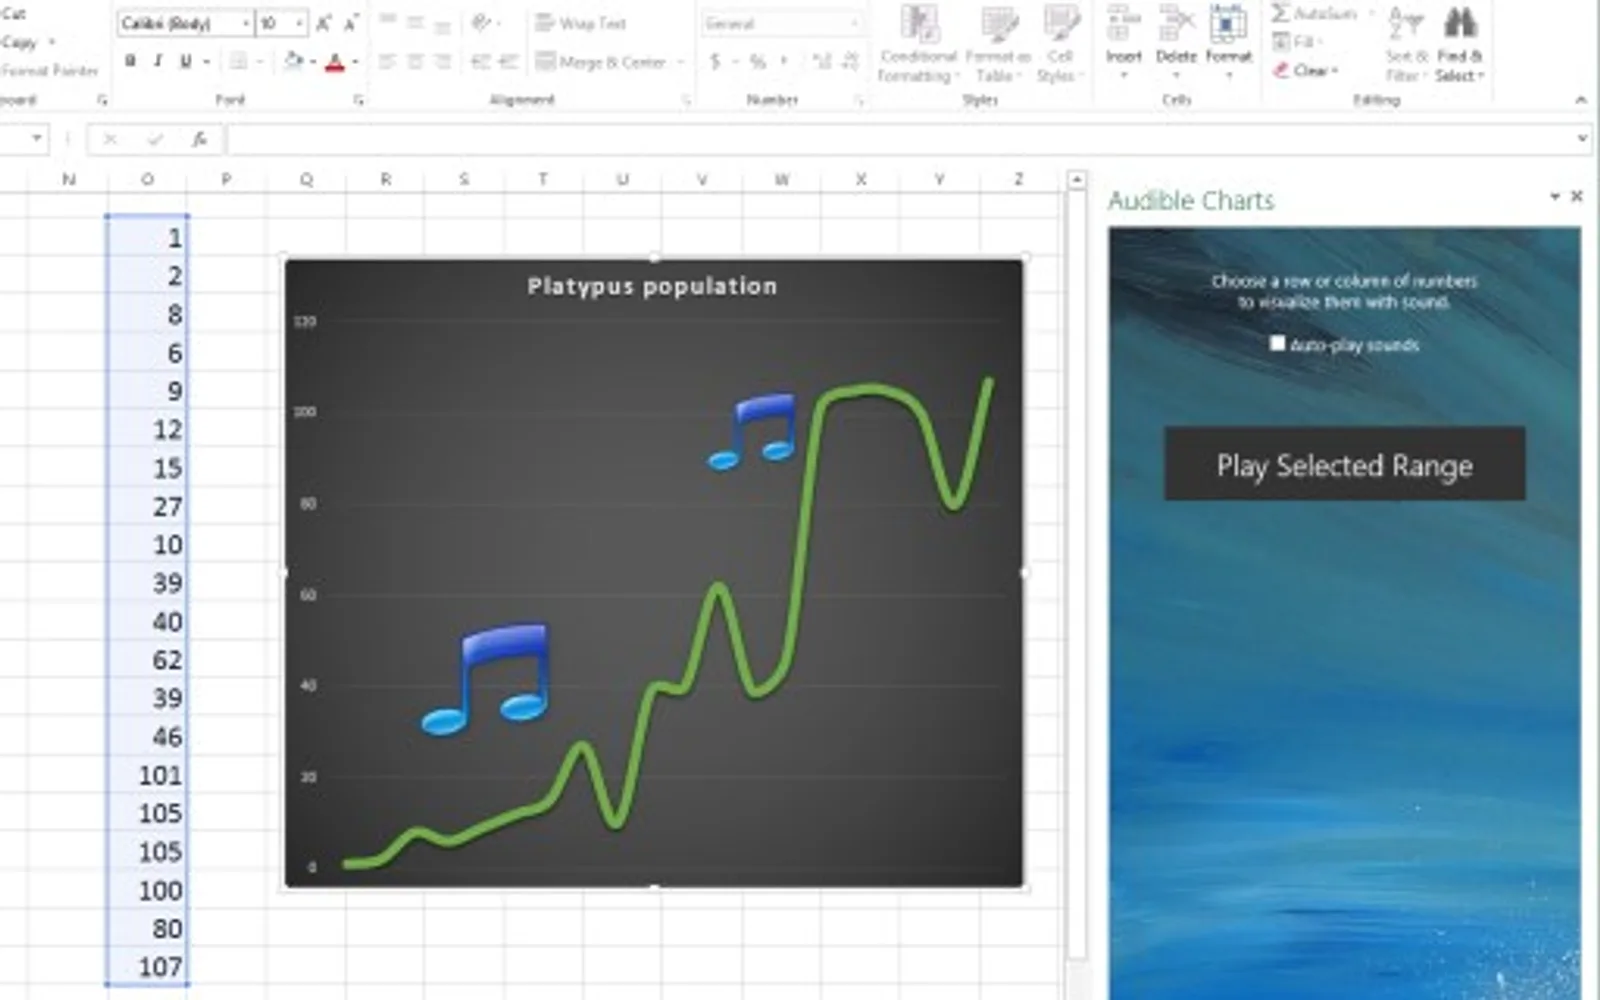
Converts selected numbers into sound, with higher pitches representing higher numbers. The vendor describes listening to a financial portfolio, hearing random data, and presenting data to someone who is blind.
Turns selected numbers into sounds for data visualization.
Uses higher pitches to represent higher numbers.
Supports listening to a financial portfolio.
Supports hearing what random data sounds like.
The vendor mentions people who are blind as an audience for the data presentation.
2,531 plugins in Analytics
Price distribution: 125 free, 147 freemium, 1,350 paid, 909 price not published
Creates visualizations from diverse chart types, combines multiple charts on one canvas, and adds custom annotations and tooltips.
Akvelon
Creates financial and business reports in Power BI with automatic variance calculations, P&L logic, and drill-down (s5, s6).
Zebra BI
COSMO Text Module provides extended text management with a WYSIWYG editor for Microsoft Dynamics 365 Business Central.
COSMO CONSULT
Discover the why behind your data.
Data Courage«This app lets you visualize your data by hearing it. Choose the numbers you want to listen to, and enjoy! Higher pitches mean higher numbers. Please have fun: -Listen to your financial portfolio. -See what random data sounds like. -Close your eyes or show it to someone who's blind.»