Chiclet Slicer
Button-based slicer for Power BI that can be arranged horizontally or as a matrix, with cross highlighting and image support.
Microsoft CorporationPaid
Displays a stock or publicly traded asset price and daily change in Excel or PowerPoint.
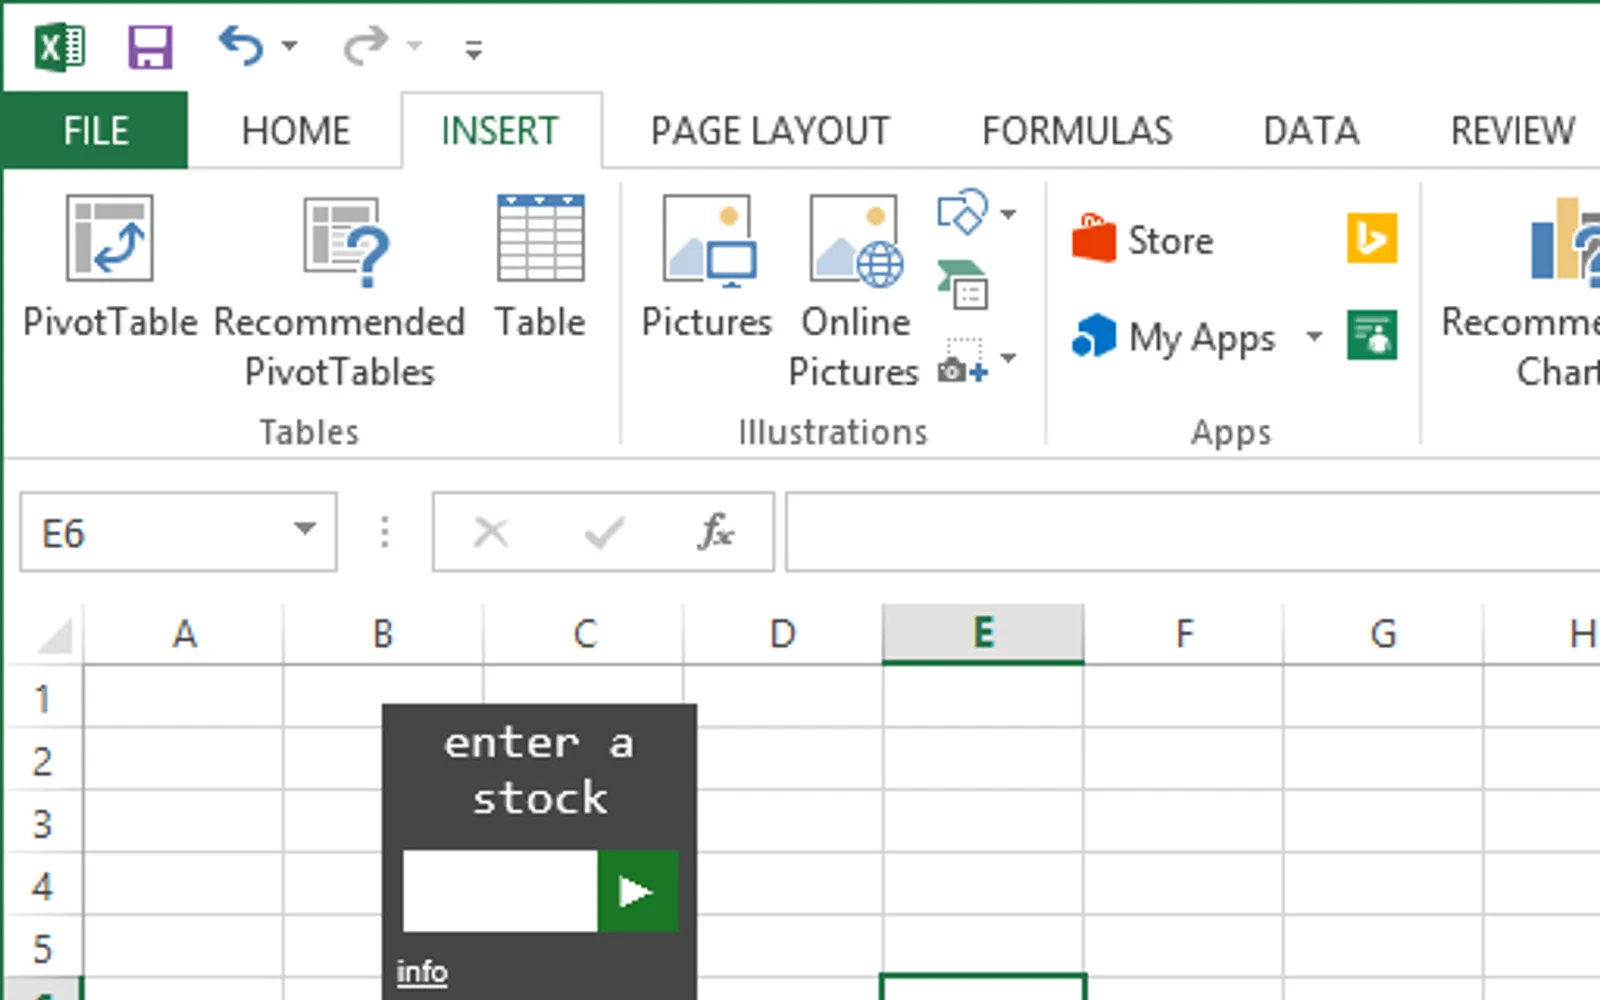
Stock Tile displays a stock or other publicly traded asset's current price and change since the previous close. Entering a ticker adds a tile to an Excel workbook or PowerPoint slide. The tile uses red or green backgrounds to show the day's movement and displays the latest data retrieval time. After market hours, it shows the last closing price and change for the previous period. Tiles can be resized and refreshed manually.
A stock ticker or ticker for another publicly traded asset adds a tile to the document.
The tile displays the current stock price in dollars.
The tile displays the dollar change since the previous close.
Red and green backgrounds indicate the stock's movement during the day.
A timestamp shows when the latest stock price data was retrieved.
Clicking the timestamp refreshes the displayed price once.
The tile can be resized using its corner handles.
33 plugins in Excel · Integration
Price distribution: 1 free, 4 paid, 28 price not published
Button-based slicer for Power BI that can be arranged horizontally or as a matrix, with cross highlighting and image support.
Microsoft Corporation
Automates formulas, data cleanup, reporting, and bulk row-by-row tasks in Microsoft Excel from plain-language prompts.
TALARIAN S. à r.l.
Artemis Sheets pulls blockchain, protocol, and stablecoin metrics into Excel workbooks using CapIQ-like formula syntax.
Artemis Analytics
Excel add-in providing real-time quotes and up to 30+ years of historical price and fundamental data for 80,000+ global assets.
SheetsFinance«Looking for a way to link live-updating stock prices to specific cells in Excel? You can do that with a different free add-in, called Stock Connector. Click the Provider "Michael Saunders" link on the left or search the Store to find it …»