
Power Plot Visual by Akvelon
Creates visualizations from diverse chart types, combines multiple charts on one canvas, and adds custom annotations and tooltips.
AkvelonFreemium
Creates maps, apps, and geographic information in a cloud-based mapping and analysis system.
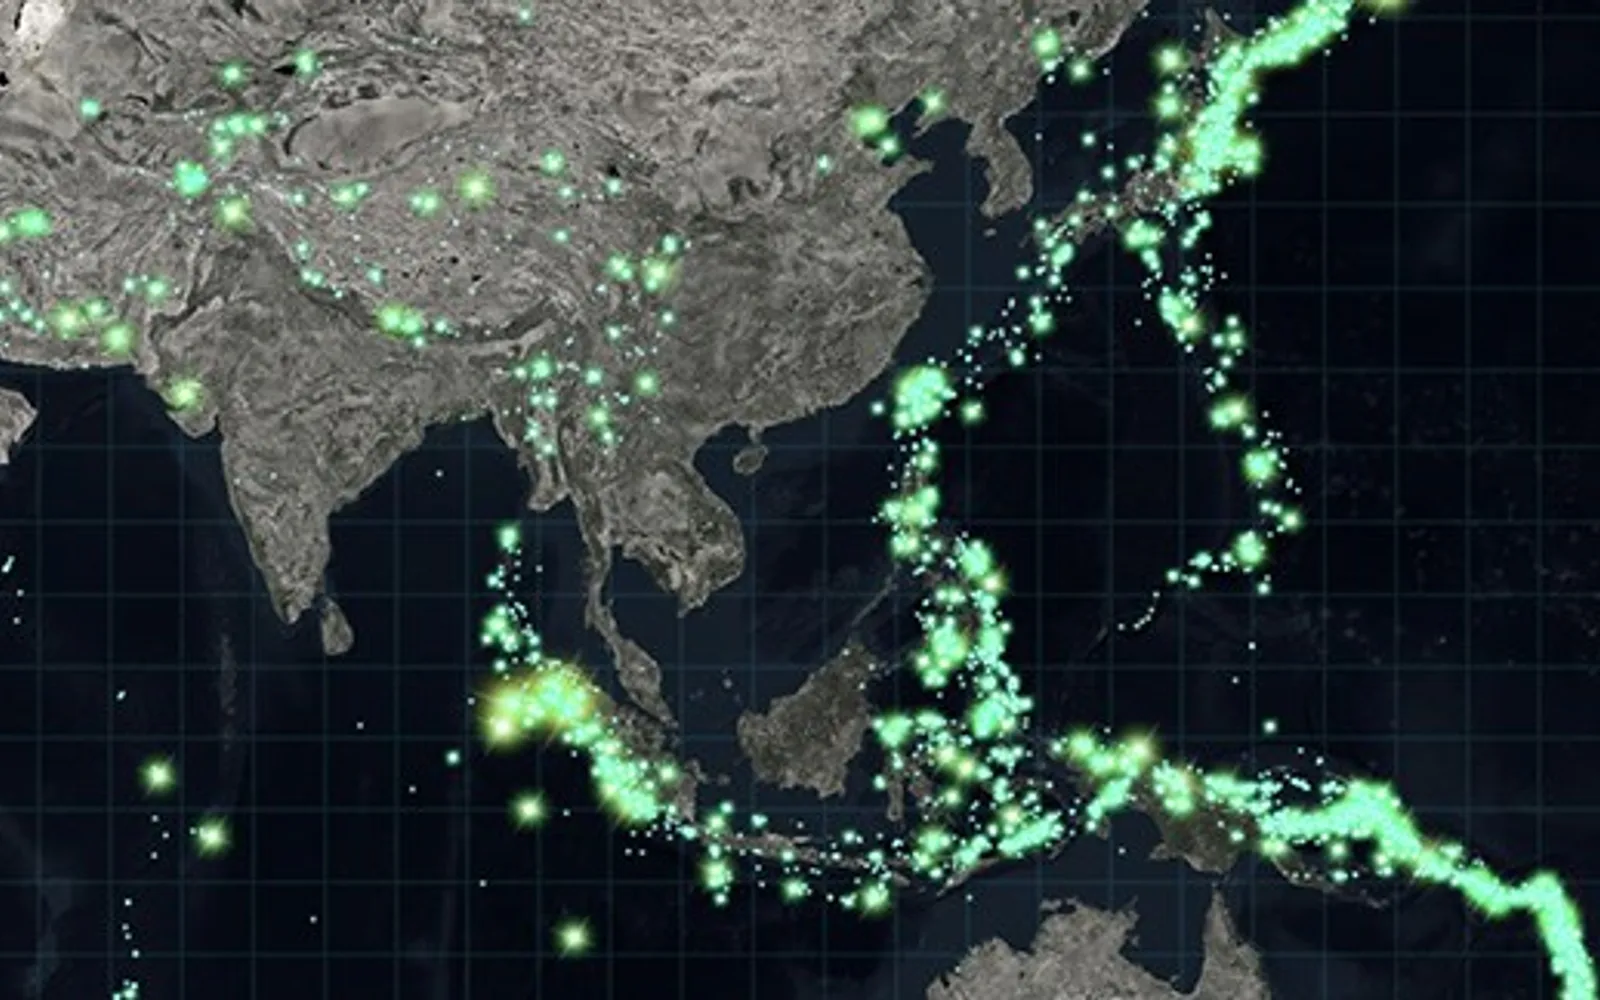
Creates interactive maps and apps using data, applies data-driven styles, and performs spatial analysis. Supports data collection, pattern and trend analysis, and sharing with staff, stakeholders, citizens, or selected groups. Geographic information can be created, organized, and managed in one system.
Creates interactive maps and apps with data.
Performs spatial analysis and supports analysis of patterns and trends in data.
Collects data for mapping and analysis.
Shares maps with staff, stakeholders, citizens, or selected groups through ready-to-use apps.
Creates, organizes, and manages geographic information in one system.
2,531 plugins in Analytics
Price distribution: 125 free, 147 freemium, 1,350 paid, 909 price not published
Creates visualizations from diverse chart types, combines multiple charts on one canvas, and adds custom annotations and tooltips.
Akvelon
Creates financial and business reports in Power BI with automatic variance calculations, P&L logic, and drill-down (s5, s6).
Zebra BI
COSMO Text Module provides extended text management with a WYSIWYG editor for Microsoft Dynamics 365 Business Central.
COSMO CONSULT
Discover the why behind your data.
Data Courage«Cloud-based Interactive Mapping and Analytics ArcGIS Online is a complete mapping, visualization and analysis solution. It enables you to connect people, locations, and data using interactive maps. Work with smart, data-driven styles and intuitive analysis tools that deliver location intelligence. Share your insights …»