
Gantt Chart
Gantt Chart is a project management visual for Microsoft Power BI that tracks schedules, milestones, and resource workloads.
ChartPadFree
Present project health in Power BI using traffic-light signals and existing project data.
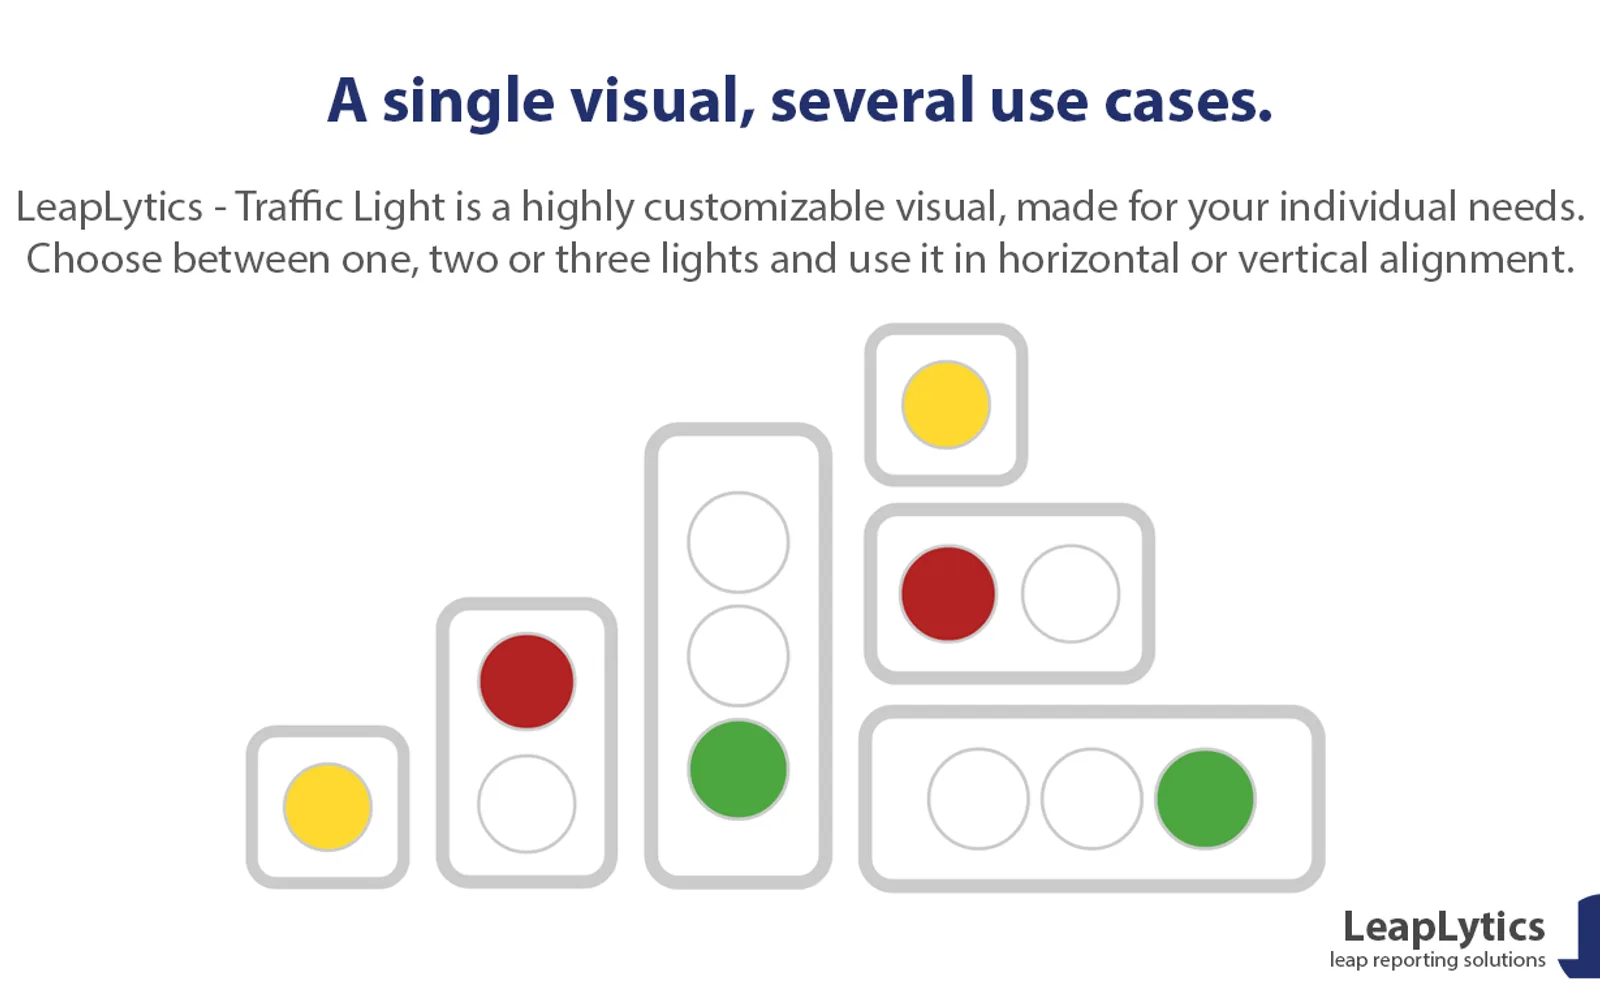
The visual connects existing project data to Power BI. It presents project health as traffic-light signals and go/no-go indicators instead of percentage updates. The listing describes its use for project status presentations to executives and leadership.
Displays project health using traffic-light signals.
Connects existing project data to Power BI.
Presents project health as go/no-go signals.
Named users include project managers, project leads, executives, leadership, CFOs, and CEOs.
657 plugins in Power BI · Analytics
Price distribution: 73 free, 108 freemium, 441 paid, 35 price not published
Gantt Chart is a project management visual for Microsoft Power BI that tracks schedules, milestones, and resource workloads.
ChartPad
Creates visualizations from diverse chart types, combines multiple charts on one canvas, and adds custom annotations and tooltips.
Akvelon
Creates financial and business reports in Power BI with automatic variance calculations, P&L logic, and drill-down (s5, s6).
Zebra BI
AI analysis app for Dynamics 365 Business Central that provides customer KPIs, churn probability, and customer grouping.
Data Courage«1,000+ Project Managers Already Transformed Their Careers With This Power BI Visual ✓ German project manager avoided €1.8M budget overrun by catching red flags 3 weeks early ✓ Canadian PM went from "always behind schedule" to "most reliable delivery lead" in 4 months ✓ Tech startup PM got VP promotion after delivering …»