
Power Plot Visual by Akvelon
Creates visualizations from diverse chart types, combines multiple charts on one canvas, and adds custom annotations and tooltips.
AkvelonFreemium
A scorecard visual compares metrics, calculates trends, and formats cards with flexible colors and layouts.
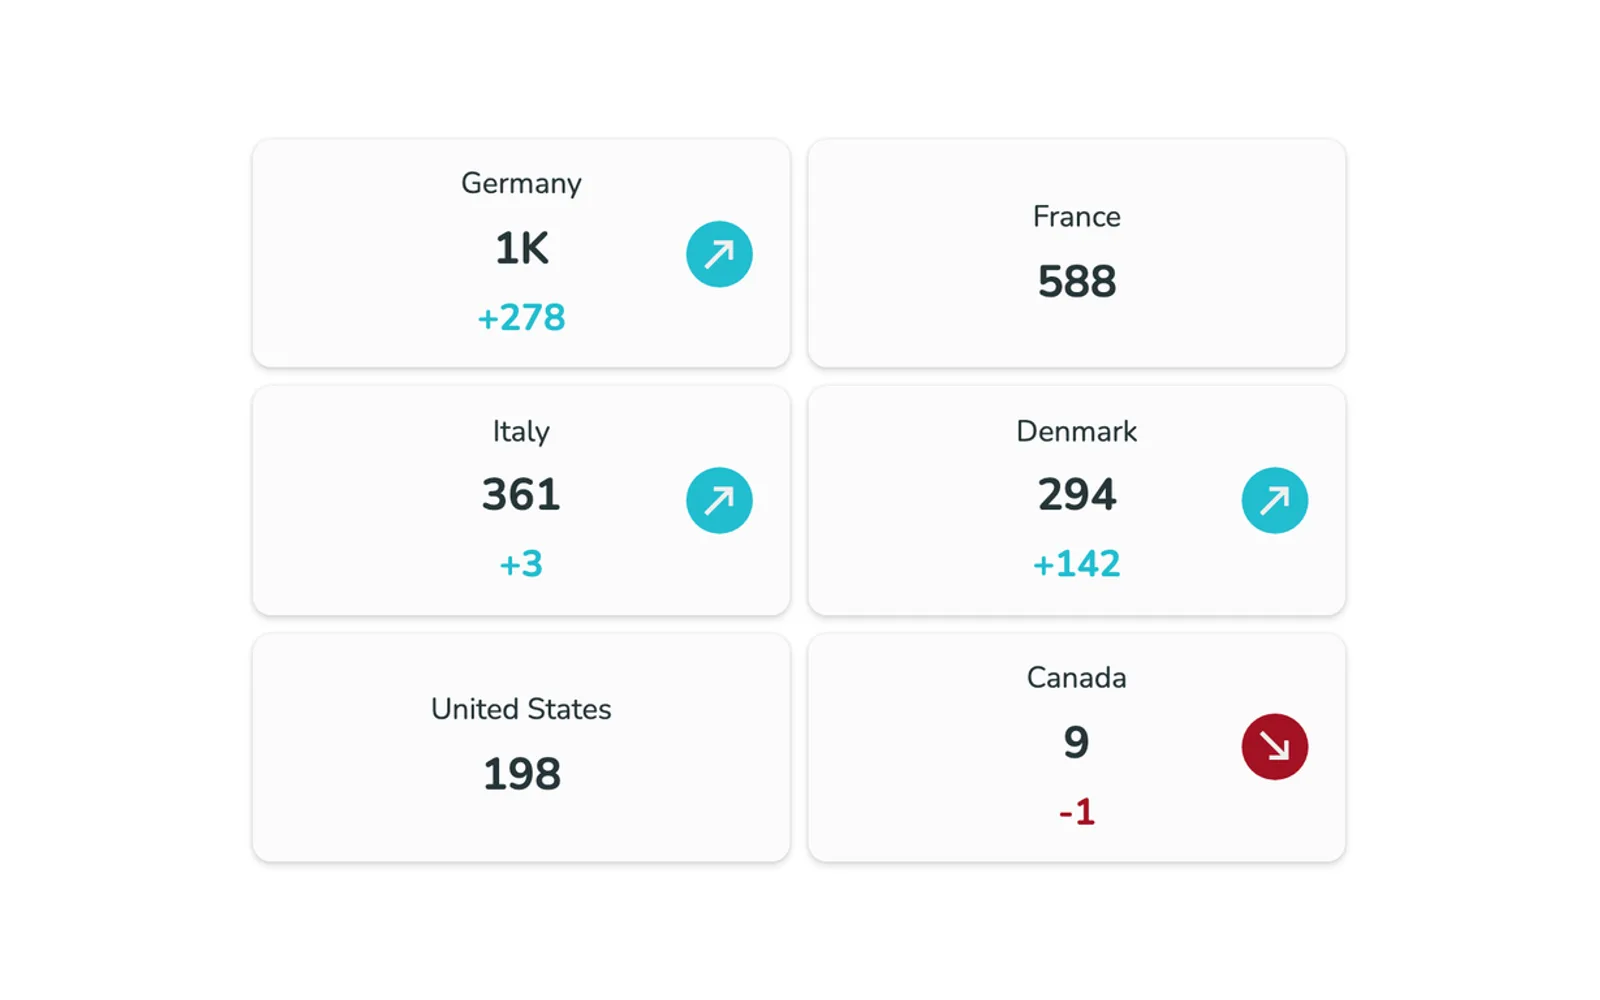
The scorecard compares metrics using options such as differences and growth. It calculates trends, supports small multiples, sorts cards automatically, and provides responsive layouts and flexible card designs. Cards can use colors based on dimension values, and the visual includes filters and tooltips. The vendor states that all features are free and require no license.
Compares metrics using options including difference and growth.
Calculates trends for the displayed metrics.
Supports small multiples in the scorecard.
Applies conditional colors to cards.
Sorts cards automatically.
Provides filters and tooltips.
Provides responsive layouts, shapes, and flexible card designs.
2,531 plugins in Analytics
Price distribution: 125 free, 147 freemium, 1,350 paid, 909 price not published
Creates visualizations from diverse chart types, combines multiple charts on one canvas, and adds custom annotations and tooltips.
Akvelon
Creates financial and business reports in Power BI with automatic variance calculations, P&L logic, and drill-down (s5, s6).
Zebra BI
COSMO Text Module provides extended text management with a WYSIWYG editor for Microsoft Dynamics 365 Business Central.
COSMO CONSULT
Discover the why behind your data.
Data Courage«Our scorecard supports small multiples, lets you compare metrics in different ways (difference, growth, etc.), and offers flexible color options — cards can take the color of their dimension value, making it easier to integrate them into dashboards and use them as category filters.»