
Gantt Chart
Gantt Chart is a project management visual for Microsoft Power BI that tracks schedules, milestones, and resource workloads.
ChartPadFree
Visualizes incident categories by severity in Power BI using a configurable 2D or 3D safety pyramid.
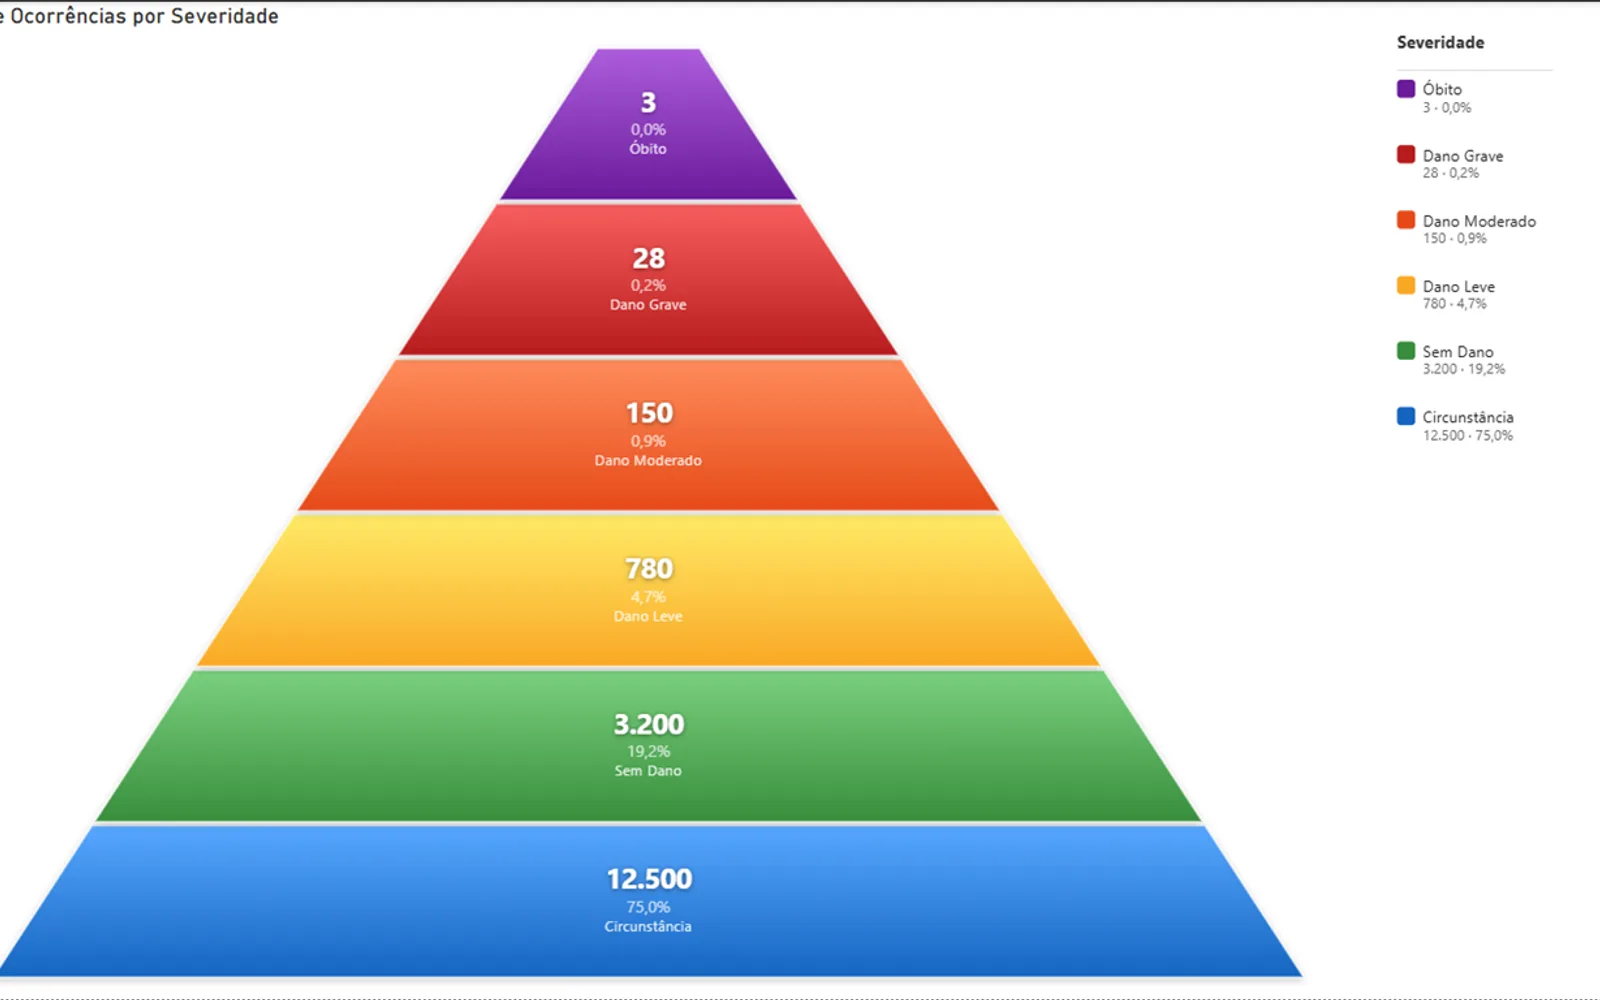
Displays incident categories in a Heinrich safety pyramid within Power BI. The visual supports flat and three-dimensional pyramid views, proportional level heights, internal or external labels, customizable colors and fonts, and normal or inverted orientation. It accepts a text category column and a numeric measure, and works with Power BI Desktop and Power BI Service.
Switches between a flat pyramid and a three-dimensional pyramid with adjustable depth.
Adjusts pyramid level heights according to category volume with configurable minimum and maximum limits.
Shows values, percentages, and categories inside the pyramid or beside it with connector lines.
Sets font family, size, bold styling, and color separately for values, percentages, and categories.
Supports full numbers, thousands, or millions with configurable decimal places and Brazilian number formatting.
Provides an editable legend title, item spacing, and value or percentage display options.
Assigns distinct colors to categories through the Power BI palette.
Shows category, value, and percentage details when the pointer moves over a pyramid level.
Safety professionals, risk managers, and quality and compliance teams.
657 plugins in Power BI · Analytics
Price distribution: 73 free, 108 freemium, 441 paid, 35 price not published
Gantt Chart is a project management visual for Microsoft Power BI that tracks schedules, milestones, and resource workloads.
ChartPad
Creates visualizations from diverse chart types, combines multiple charts on one canvas, and adds custom annotations and tooltips.
Akvelon
Creates financial and business reports in Power BI with automatic variance calculations, P&L logic, and drill-down (s5, s6).
Zebra BI
AI analysis app for Dynamics 365 Business Central that provides customer KPIs, churn probability, and customer grouping.
Data Courage«O Safety Pyramid é um visual personalizado para Power BI que representa a Pirâmide de Heinrich (Pirâmide de Segurança), amplamente utilizada em gestão de segurança do trabalho e saúde ocupacional para classificar incidentes por severidade. Funcionalidades principais: - Pirâmide 2D e 3D: Alterne entre visualização …»