
Gantt Chart
Gantt Chart is a project management visual for Microsoft Power BI that tracks schedules, milestones, and resource workloads.
ChartPadFree
Display navigable GitHub-style markdown content inside Power BI reports.
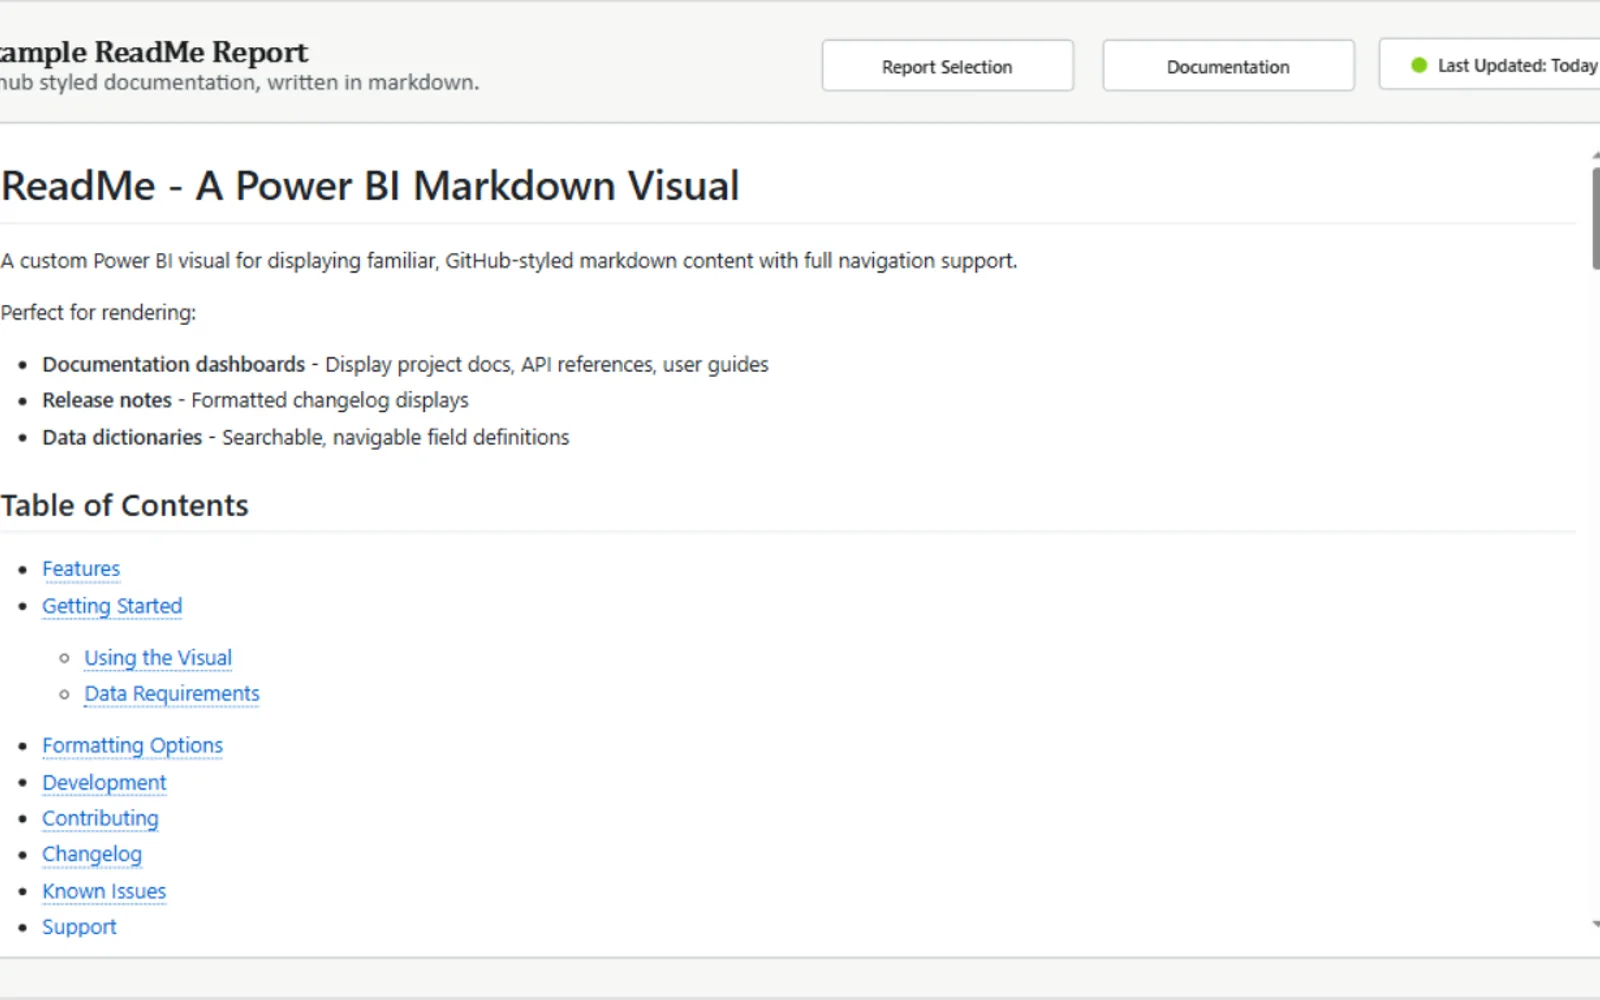
ReadMe displays markdown content in Power BI reports with GitHub-style formatting. It supports headers, tables, code blocks, linked indexes, and external image links. Text scaling adjusts typography, and markdown text can be added without configuration. The visual can be used for documentation dashboards, release notes, and data dictionaries.
Displays headers, tables, code blocks, linked indexes, and other markdown content.
Formats markdown content using GitHub markdown CSS styling.
Supports navigation through linked tables of contents and headers.
Allows external image links in markdown content.
Scales text to maintain typography standards.
Data analysts, BI developers, project managers, and technical teams.
1,395 plugins in Power BI · Analytics
Price distribution: 89 free, 137 freemium, 680 paid, 489 price not published
Gantt Chart is a project management visual for Microsoft Power BI that tracks schedules, milestones, and resource workloads.
ChartPad
Creates visualizations from diverse chart types, combines multiple charts on one canvas, and adds custom annotations and tooltips.
Akvelon
Creates financial and business reports in Power BI with automatic variance calculations, P&L logic, and drill-down (s5, s6).
Zebra BI
AI analysis app for Dynamics 365 Business Central that provides customer KPIs, churn probability, and customer grouping.
Data Courage«A custom Power BI visual for displaying familiar, GitHub-styled markdown content with full navigation support. Perfect for creating documentation dashboards, formatted release notes, and searchable data dictionaries in your Power BI reports. Key features: • Authentic GitHub markdown CSS styling • Full markdown …»