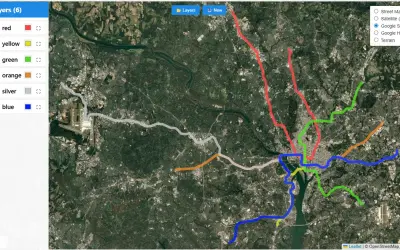
kml-kmz-visual
KML/KMZ Viewer renders points, lines, and polygons from KML and KMZ files on interactive maps within Power BI reports.
Abdalla DabesPaid
Displays routes between points in Power BI using open-source mapping tools.
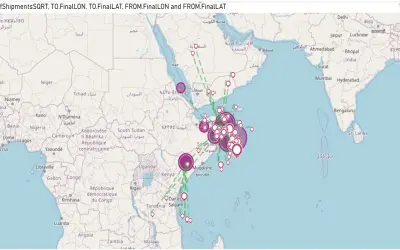
The visualization displays routes between points in Power BI for logistics projects. It uses React and incorporates features and requirements from React 19.1 and Power BI Visuals API/Framework 5.11.0.
Displays routes between points in Power BI.
Uses open-source mapping tools for the visualization.
657 plugins in Power BI · Analytics
Price distribution: 73 free, 108 freemium, 441 paid, 35 price not published
KML/KMZ Viewer renders points, lines, and polygons from KML and KMZ files on interactive maps within Power BI reports.
Abdalla Dabes
D3.js Visual for Power BI provides a skeleton framework to build or adapt custom D3.js visuals within the Power BI environment.
DataScenarios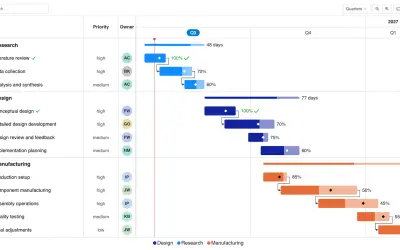
Gantt Chart is a project management visual for Microsoft Power BI that tracks schedules, milestones, and resource workloads.
ChartPad
Creates visualizations from diverse chart types, combines multiple charts on one canvas, and adds custom annotations and tooltips.
Akvelon«Several years ago I found that there was not a good Power BI Map Visualization (using Open Source Mapping tools) to show routes between points for use in logistics projects. This is a rewrite of that visualization using React rather than D3, as well as incorporating many of the new features and requirements of the …»