
Gantt Chart
Gantt Chart is a project management visual for Microsoft Power BI that tracks schedules, milestones, and resource workloads.
ChartPadFree
Manage Power BI content, administration, embedding, bulk security, and dataset operations in the cloud.
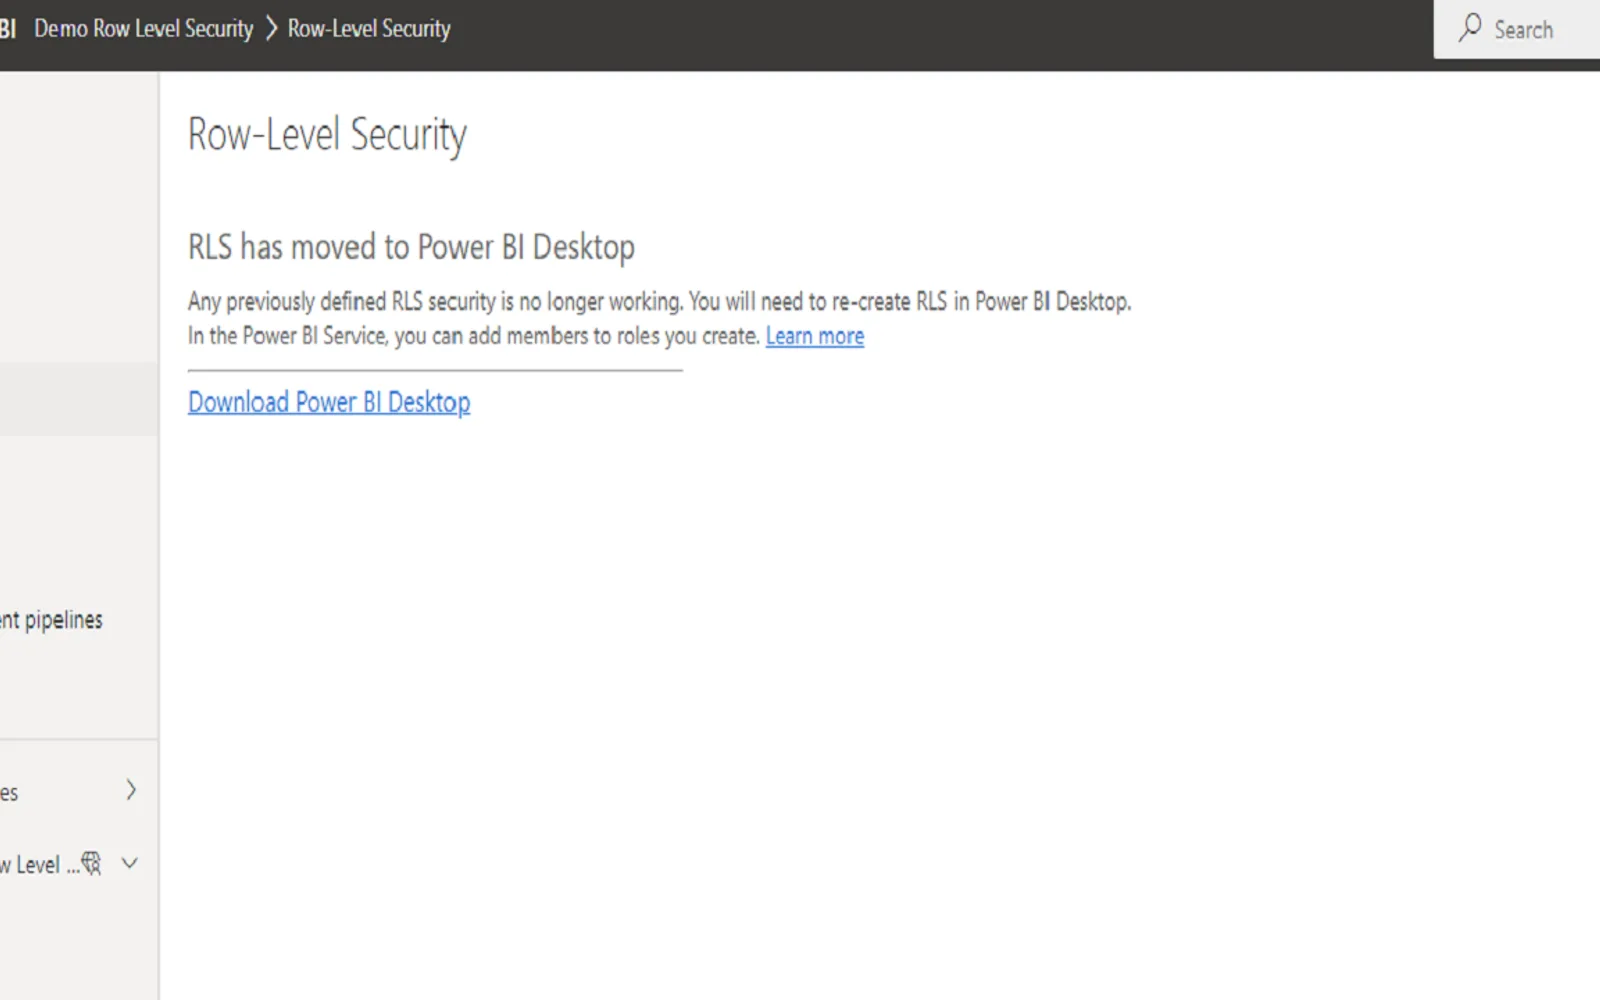
Manages Power BI content and administrative operations through Power BI REST APIs. Supports bulk row-level security using defined roles, filters, and user associations. Transfers datasets between workspaces, manages workspace users in bulk, and refreshes datasets on demand. Downloads report tables with more than 150K rows and embeds Power BI content.
Defines roles, filters, and user associations in files for bulk row-level security setup.
Transfers or copies datasets between workspaces while retaining row-level security.
Adds or removes workspace users in bulk and assigns them to roles.
Downloads report tables containing more than 150K rows.
Refreshes datasets on demand without moving between workspaces.
Embeds Power BI content.
657 plugins in Power BI · Analytics
Price distribution: 73 free, 108 freemium, 441 paid, 35 price not published
Gantt Chart is a project management visual for Microsoft Power BI that tracks schedules, milestones, and resource workloads.
ChartPad
Creates visualizations from diverse chart types, combines multiple charts on one canvas, and adds custom annotations and tooltips.
Akvelon
Creates financial and business reports in Power BI with automatic variance calculations, P&L logic, and drill-down (s5, s6).
Zebra BI
AI analysis app for Dynamics 365 Business Central that provides customer KPIs, churn probability, and customer grouping.
Data Courage«PowerBIsight is the product of durkhun.com. It is built on powerBI rest apis. PowerBISight Enables you to • Manage PowerBI Content • Admin operations • Embed Power BI Content Features Bulk Row Level Security This feature enables users to implement the Row Level Security in Bulk. Normally a user have to implement many …»