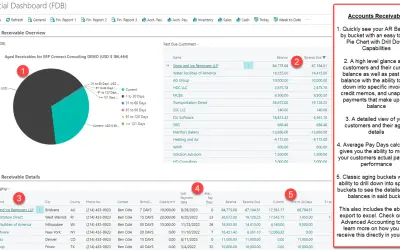
Financial Dashboard
This version supports the NA, GB, AU, NL, FR, DE, NZ, W1, FI, SE, W1 Localizations only.
RUX SoftwarePaid
Display metrics, KPIs, trends, and scorecard data in a customizable Power BI matrix.
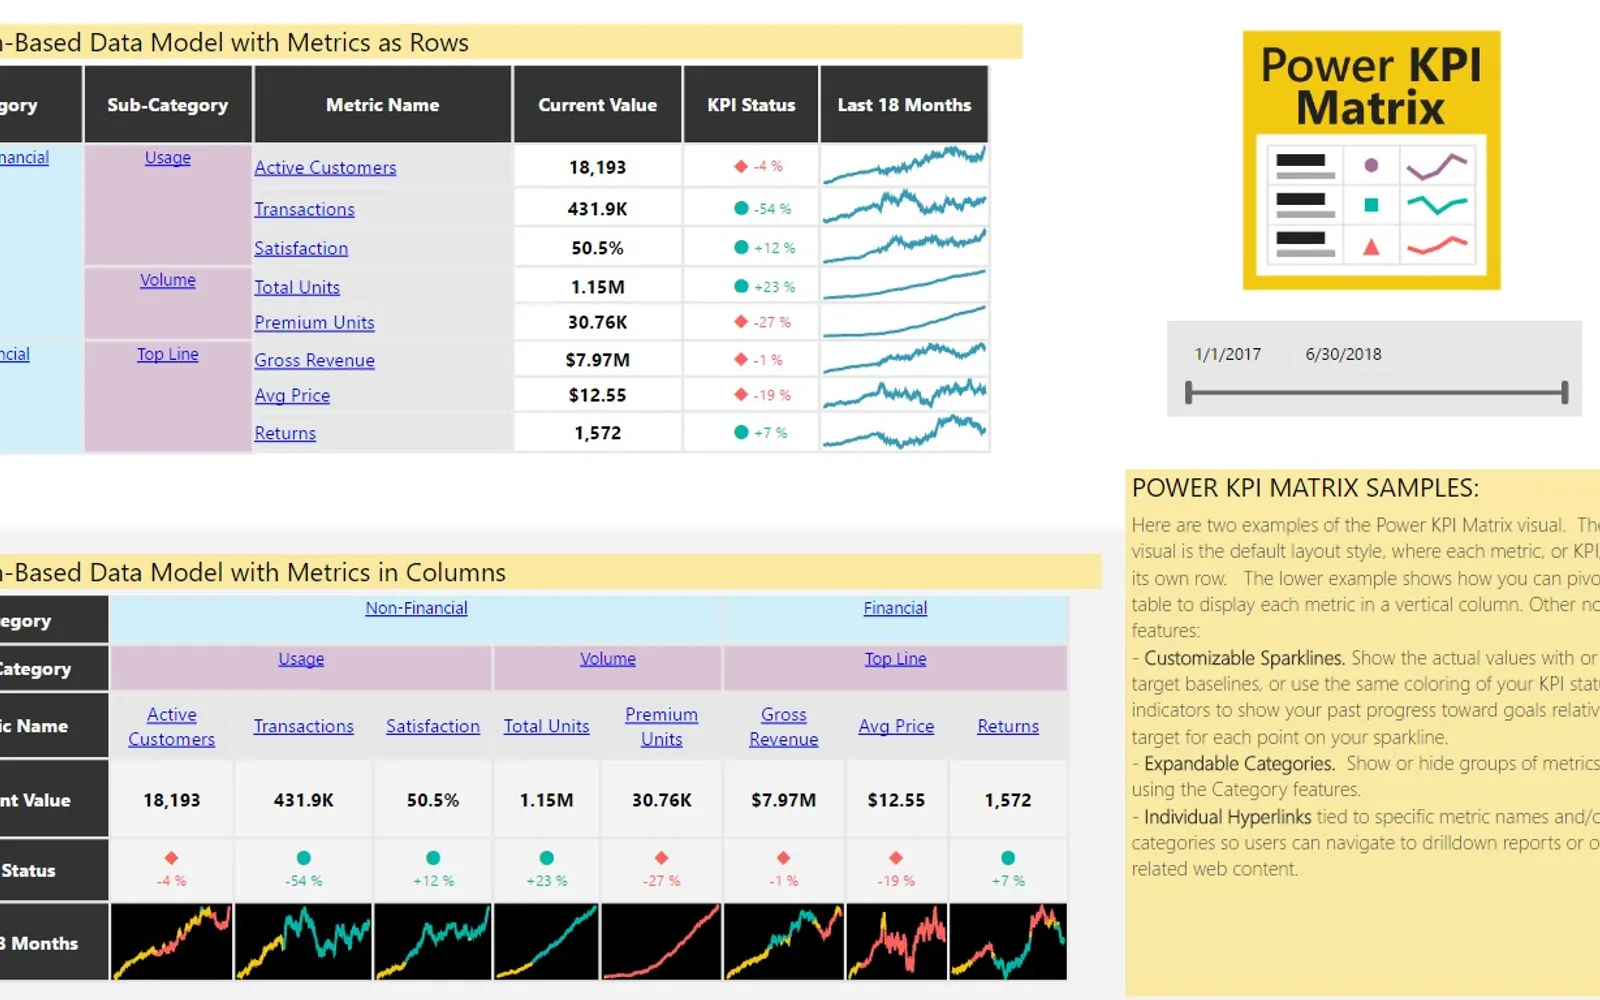
Power KPI Matrix displays metrics and KPIs in a tabular list in Power BI, including current values, targets, variances, status symbols, and historical trends. It supports column-based and row-based metric sources and can present metrics as rows or columns. Categories can be expanded or hidden, with optional subtotals for additive items. Cells, rows, columns, charts, fonts, colors, formats, and table themes can be configured.
Choose symbols and define color and symbol thresholds for KPI performance relative to targets.
Display actual-value trends with optional target baselines or KPI-status coloring.
Show or hide metric groups and optionally display subtotals for additive items.
Attach hyperlinks to metric names or categories for navigation to reports or web content.
Change row heights and column widths by dragging their borders.
Configure cell, row, and column colors, fonts, grid lines, number formats, chart styles, and dimensions.
Select from predefined table formats, including alternate row shading.
Open a Power KPI chart from a non-hyperlinked cell to view trend details.
Power KPI Matrix and Financial Dashboard are both paid cloud listings; Financial Dashboard was updated in Aug 2026, while Power KPI Matrix was updated on Dec 2024. Advance Card is also a paid cloud listing and was updated in Oct 2024. Bullet Chart - xViz uses a freemium pricing model, while Power KPI Matrix uses a paid pricing model; both are cloud listings, and Bullet Chart - xViz was updated in Dec 2025.
| Name | Pricing | Deployment | Updated |
|---|---|---|---|
| this plugin | Paid | Cloud | |
| Power KPI | Paid | Cloud | |
| Financial Dashboard | Paid | Cloud | |
| Advance Card | Paid | Cloud | |
| Bullet Chart - xViz | Freemium | Cloud |
1,008 plugins in Power BI · Analytics
Price distribution: 75 free, 112 freemium, 520 paid, 301 price not published
This version supports the NA, GB, AU, NL, FR, DE, NZ, W1, FI, SE, W1 Localizations only.
RUX Software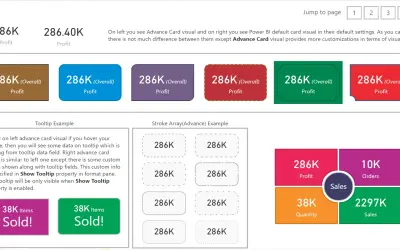
Custom card visual for Power BI that extends the default card with conditional formatting, tooltips, and alignment options.
Bhavesh Jadav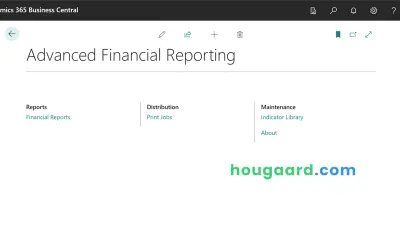
Reporting app for Dynamics 365 Business Central that generates Excel or PowerBI reports from data inside and outside the G/L.
Hougaard
Power BI custom visual that fills an SVG icon to show KPI progress toward a target instead of a plain number on a card.
NeenOpal Inc«Power KPI Matrix enables balanced scorecards in Power BI and displays an unlimited number of metrics and KPIs in a single, customized list. Power KPI Matrix is similar to the Power KPI custom visual in supporting the creation and display of KPI indicator symbols and values along with current and historical trends of …»