
Gantt Chart
Gantt Chart is a project management visual for Microsoft Power BI that tracks schedules, milestones, and resource workloads.
ChartPadFree
Controls Power BI Embedded access centrally and shares dashboards and reports through a portal.
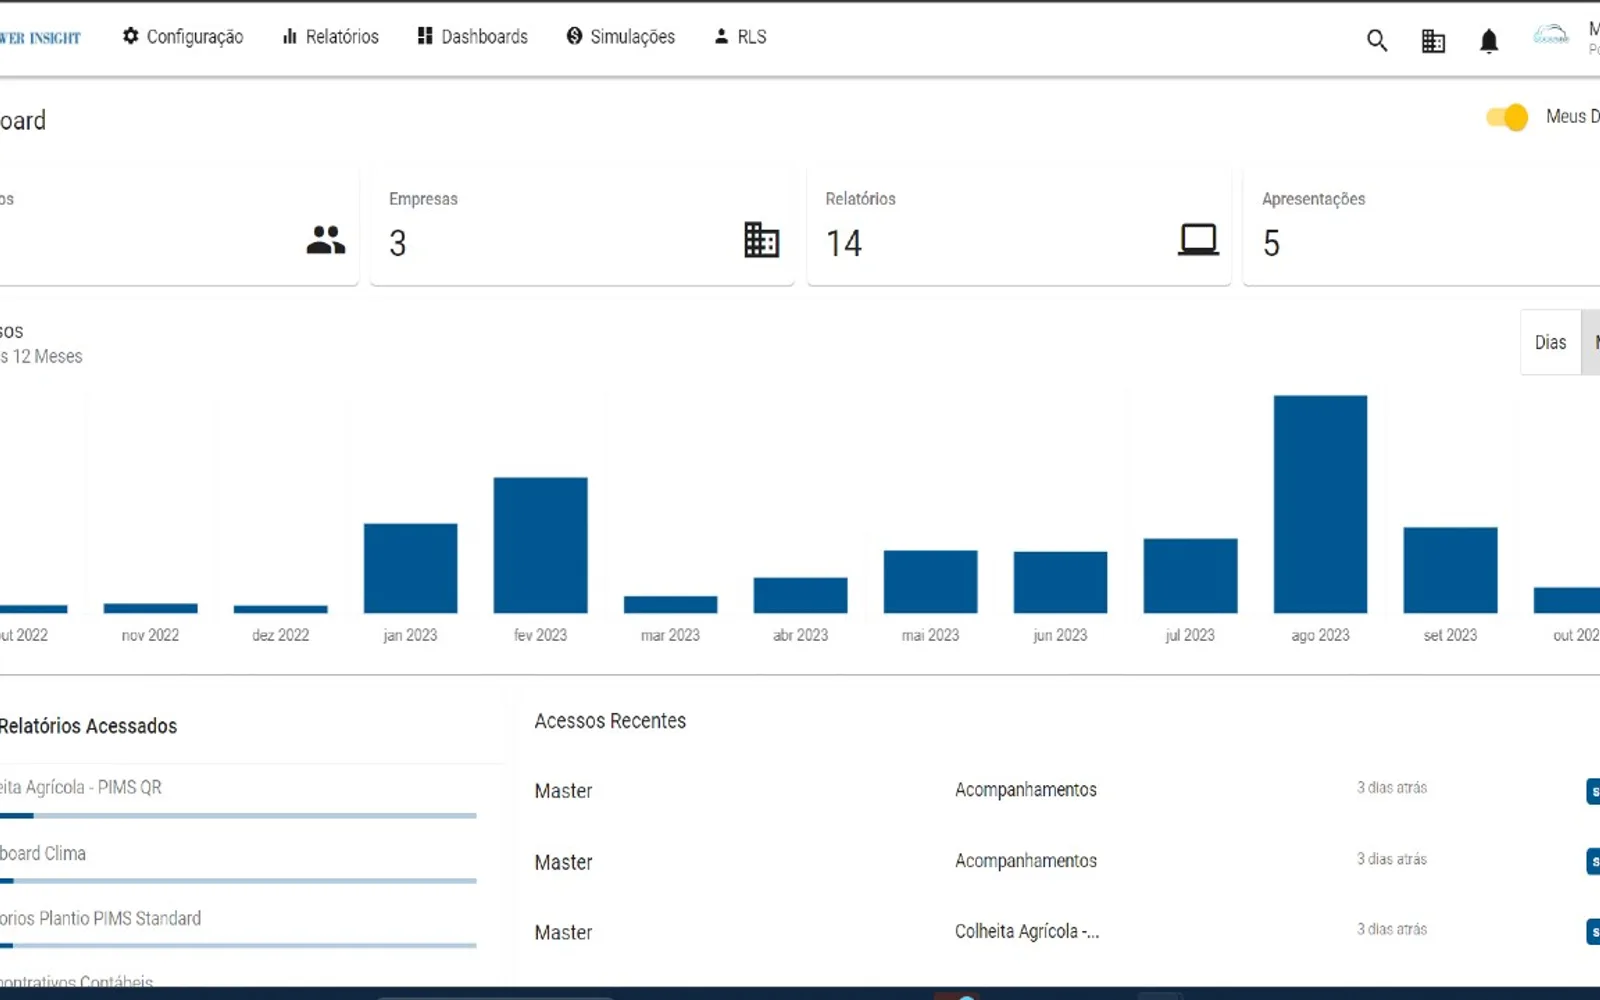
Integrates with Power BI Embedded APIs to control access centrally and share dashboards and reports with users through the Power Insight portal. The vendor states that the portal uses one master Power BI license while other users access reports and dashboards through the portal.
Integrates directly with APIs from Power BI Embedded.
Controls user access centrally through the system.
Shares Power BI dashboards and reports with users.
Controls users who access reports and dashboards through the Power Insight portal.
657 plugins in Power BI · Analytics
Price distribution: 73 free, 108 freemium, 441 paid, 35 price not published
Gantt Chart is a project management visual for Microsoft Power BI that tracks schedules, milestones, and resource workloads.
ChartPad
Creates visualizations from diverse chart types, combines multiple charts on one canvas, and adds custom annotations and tooltips.
Akvelon
Creates financial and business reports in Power BI with automatic variance calculations, P&L logic, and drill-down (s5, s6).
Zebra BI
AI analysis app for Dynamics 365 Business Central that provides customer KPIs, churn probability, and customer grouping.
Data Courage«O sistema da Power Insight tem integração direta com APIs do Power BI Embedded, o que permite que o controle os acessos de forma centralizada e compartilhamento dos painéis e relatórios aos usuários com segurança. A utilização do portal reduz em até 80% os custos de licenciamentos do Power BI, sendo preciso apenas uma …»