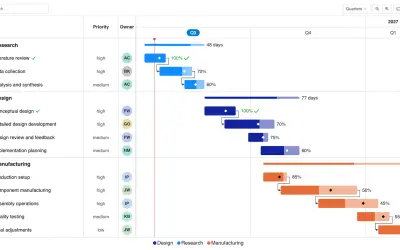
Gantt Chart
Gantt Chart is a project management visual for Microsoft Power BI that tracks schedules, milestones, and resource workloads.
ChartPadFree
Extends Excel work with responses collected through Nexticy forms and connects the data with Power BI.
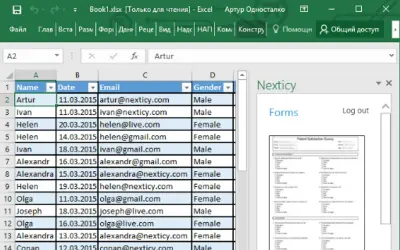
The Nexticy add-in extends Excel for working with responses from Nexticy forms. It connects collected data with Microsoft Power BI for visualization.
Works with responses collected through Nexticy forms in Excel.
Connects collected data with Microsoft Power BI.
Uses Microsoft Power BI to visualize collected data.
1,008 plugins in Power BI · Analytics
Price distribution: 75 free, 112 freemium, 520 paid, 301 price not published
Gantt Chart is a project management visual for Microsoft Power BI that tracks schedules, milestones, and resource workloads.
ChartPad
Creates visualizations from diverse chart types, combines multiple charts on one canvas, and adds custom annotations and tooltips.
Akvelon
Creates financial and business reports in Power BI with automatic variance calculations, P&L logic, and drill-down (s5, s6).
Zebra BI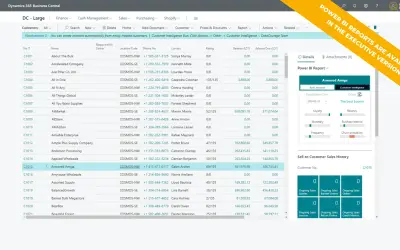
AI analysis app for Dynamics 365 Business Central that provides customer KPIs, churn probability, and customer grouping.
Data Courage«Nexticy add-in is an application for Microsoft Excel that enlarges capabilities of work with responses from your Nexticy forms. It offers integration of collected data with Microsoft Power BI to visualize it for deeper understanding.»