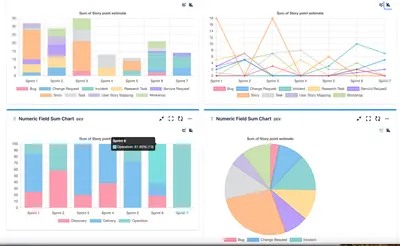
Numeric Custom Field Chart
Create Jira dashboard charts and tables from numeric custom fields, grouped by dates, sprints, issues, epics, assignees, or other fields.
erinFree
Analyze Jira sprint data with charts, tables, filters, configurable metrics, and historical views.
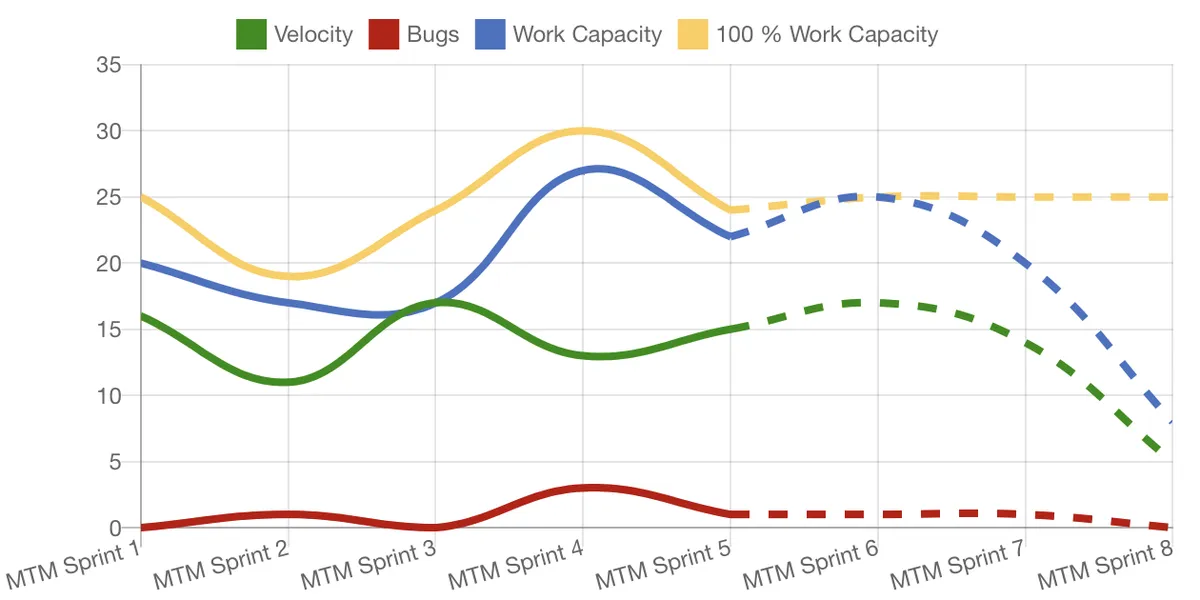
Metimur reads sprint data from Jira and presents it in a line graph, bar chart, and table. It calculates statistics and can create a one-line summary of the last selected number of sprints. Shown sprints can be filtered, while the visible data and indicators can be configured. Bug counting can be configured, and Jira permission schemes control who can view or edit the statistics.
Displays sprint data in a line graph, bar chart, and table.
Shows historical indicators for a configurable number of previous sprints.
Shows the kinds of work completed during previous sprints.
Allows selection of the indicators and data shown in each view.
Allows bugs to be counted as bugs or excluded from the count.
Uses Jira permission schemes to restrict access to viewing and editing statistics.
Metimur is intended for Scrum teams.
630 plugins in Jira · Data and analytics
Price distribution: 189 free, 230 freemium, 211 paid
Create Jira dashboard charts and tables from numeric custom fields, grouped by dates, sprints, issues, epics, assignees, or other fields.
erinJira gadgets show Agile team trends, sprint progress, velocity, and performance metrics.
AGIL4YOU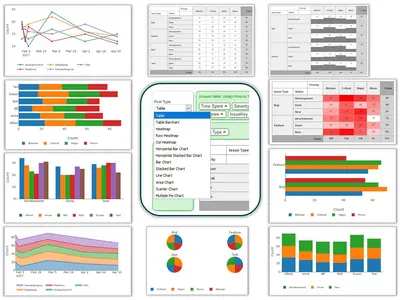
Analyze Jira issue data through configurable pivot tables, dashboard charts, and report views.
Mirrorlake Software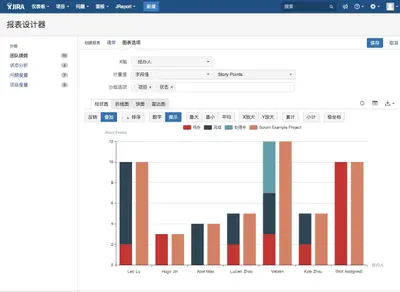
Create Jira reports, charts, and dashboard gadgets from project and issue data.
Shanghai Digital Talent Technology Co., Ltd.«Unlike Jira´s built-in reports tab, Metimur is explicitly designed for your Scrum team to help your team to stay on top of your sprints. Metimur consists of three main parts: a line graph, a bar chart and a table overview containing all your sprint data. Metimur pulls all necessary data from your Jira instance and …»