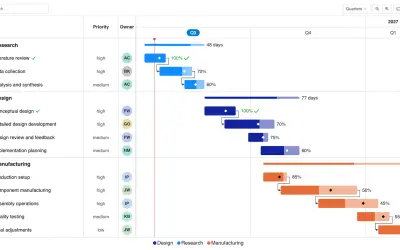
Gantt Chart
Gantt Chart is a project management visual for Microsoft Power BI that tracks schedules, milestones, and resource workloads.
ChartPadFree
Embed formatted documentation and Mermaid diagrams in Power BI reports.
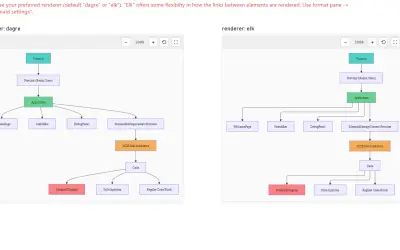
Embeds formatted text and documentation in Power BI reports using Markdown syntax. Renders Mermaid diagrams, including flowcharts, process diagrams, and entity relationship diagrams.
Displays formatted text in Power BI reports using Markdown syntax.
Embeds documentation directly in Power BI reports.
Renders Mermaid flowcharts, process diagrams, and entity relationship diagrams.
693 plugins in Power BI · Analytics
Price distribution: 73 free, 108 freemium, 471 paid, 41 price not published
Gantt Chart is a project management visual for Microsoft Power BI that tracks schedules, milestones, and resource workloads.
ChartPad
Creates visualizations from diverse chart types, combines multiple charts on one canvas, and adds custom annotations and tooltips.
Akvelon
Creates financial and business reports in Power BI with automatic variance calculations, P&L logic, and drill-down (s5, s6).
Zebra BI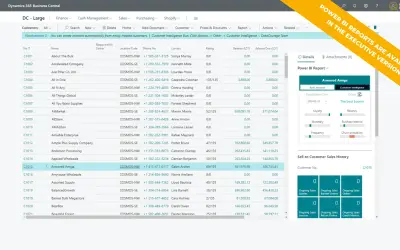
AI analysis app for Dynamics 365 Business Central that provides customer KPIs, churn probability, and customer grouping.
Data Courage«This visual allows you to embed rich documentation and diagrams in your Power BI reports using standard Markdown syntax and Mermaid diagram notation. It's perfect for: - display any kind of formatted text - Embedding documentation directly in Power BI reports - Visualising mermaid diagrams such as flowcharts, process …»