
kml-kmz-visual
KML/KMZ Viewer renders points, lines, and polygons from KML and KMZ files on interactive maps within Power BI reports.
Abdalla DabesPaid
Create custom map visualizations in Power BI with built-in or Mapbox Studio styles.
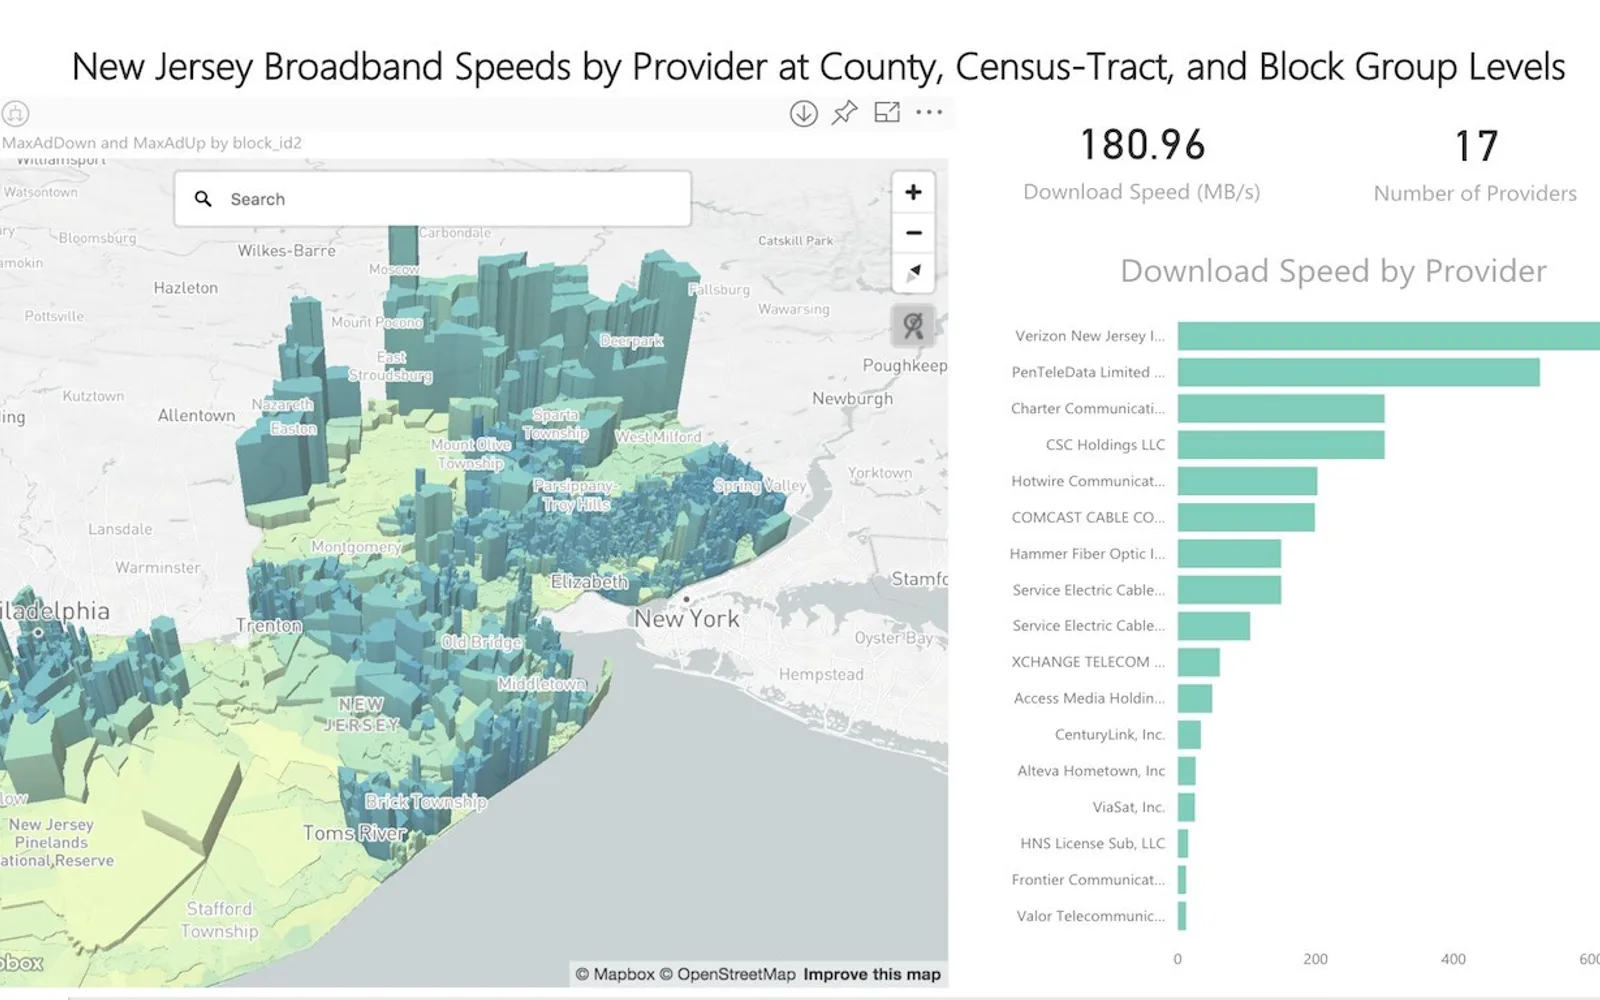
Creates map visualizations in Power BI using heatmaps, graduated circles, extruded polygons, raster layers, and cluster aggregation maps. It supports built-in map styles and custom styles from Mapbox Studio. Users can customize colors, shapes, labels, and opacity, and use lasso or polygon selections to filter other dashboard visualizations. The visual supports Power BI Report Server and Mapbox on-premise servers.
Supports heatmaps, graduated circles, extruded polygons, raster layers, and cluster aggregation maps.
Adds custom Mapbox Studio styles to Power BI.
Clusters data by sum, minimum, maximum, or average measure value.
Uses included country, state, and postal code shapes or imported KML, shape, and GeoJSON files.
Provides lasso and polygon selection modes that drive filters for other dashboard visualizations.
Automatically generates legends for the map visual.
Supports Power BI Report Server and Mapbox on-premise server.
Mapbox Custom Visual is paid and cloud-deployed, like kml-kmz-visual, D3.js Visual - create your own custom visual, and Custom Calendar by Akvelon. Drill Down Map PRO (Filter) by ZoomCharts and Smart Grid-Map are freemium cloud alternatives. Mapbox Custom Visual lists an update date of Apr 2024, compared with Feb 2026 for kml-kmz-visual, Sep 2025 for D3.js Visual - create your own custom visual, Aug 2026 for Drill Down Map PRO (Filter) by ZoomCharts, Dec 2025 for Smart Grid-Map, and Sep 2025 for Custom Calendar by Akvelon.
| Name | Pricing | Deployment | Updated |
|---|---|---|---|
| this plugin | Paid | Cloud | |
| kml-kmz-visual | Paid | Cloud | |
| D3.js Visual - create your own custom visual | Paid | Cloud | |
| Custom Calendar by Akvelon | Paid | Cloud | |
| Drill Down Map PRO (Filter) by ZoomCharts | Freemium | Cloud | |
| Smart Grid-Map | Freemium | Cloud |
657 plugins in Power BI · Analytics
Price distribution: 73 free, 108 freemium, 441 paid, 35 price not published
KML/KMZ Viewer renders points, lines, and polygons from KML and KMZ files on interactive maps within Power BI reports.
Abdalla Dabes
D3.js Visual for Power BI provides a skeleton framework to build or adapt custom D3.js visuals within the Power BI environment.
DataScenarios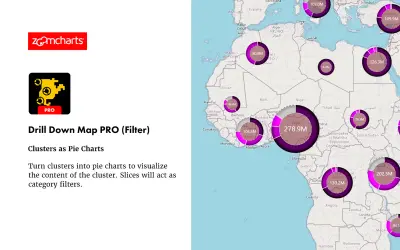
Drill Down Map PRO (Filter) by ZoomCharts visualizes and filters location data on interactive maps for Power BI Desktop reports.
ZoomCharts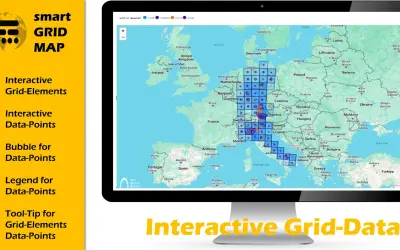
Smart Grid-Map is a custom Power BI visual for visualizing and analyzing grid and raster data with interactive polygons.
The Green Bridge GmbH«Create powerful custom map visualizations all in Power BI with the Mapbox Visual. Mapbox makes it easy to visualize location data with the exact context your dashboard needs. Choose from 8 default styles including traffic and satellite, or bring your own custom map. Do it all with blazing fast performance on large …»