
kml-kmz-visual
KML/KMZ Viewer renders points, lines, and polygons from KML and KMZ files on interactive maps within Power BI reports.
Abdalla DabesPaid
Maps geographic data in Microsoft Power BI with custom regions, bubbles, markers, and field comparisons.
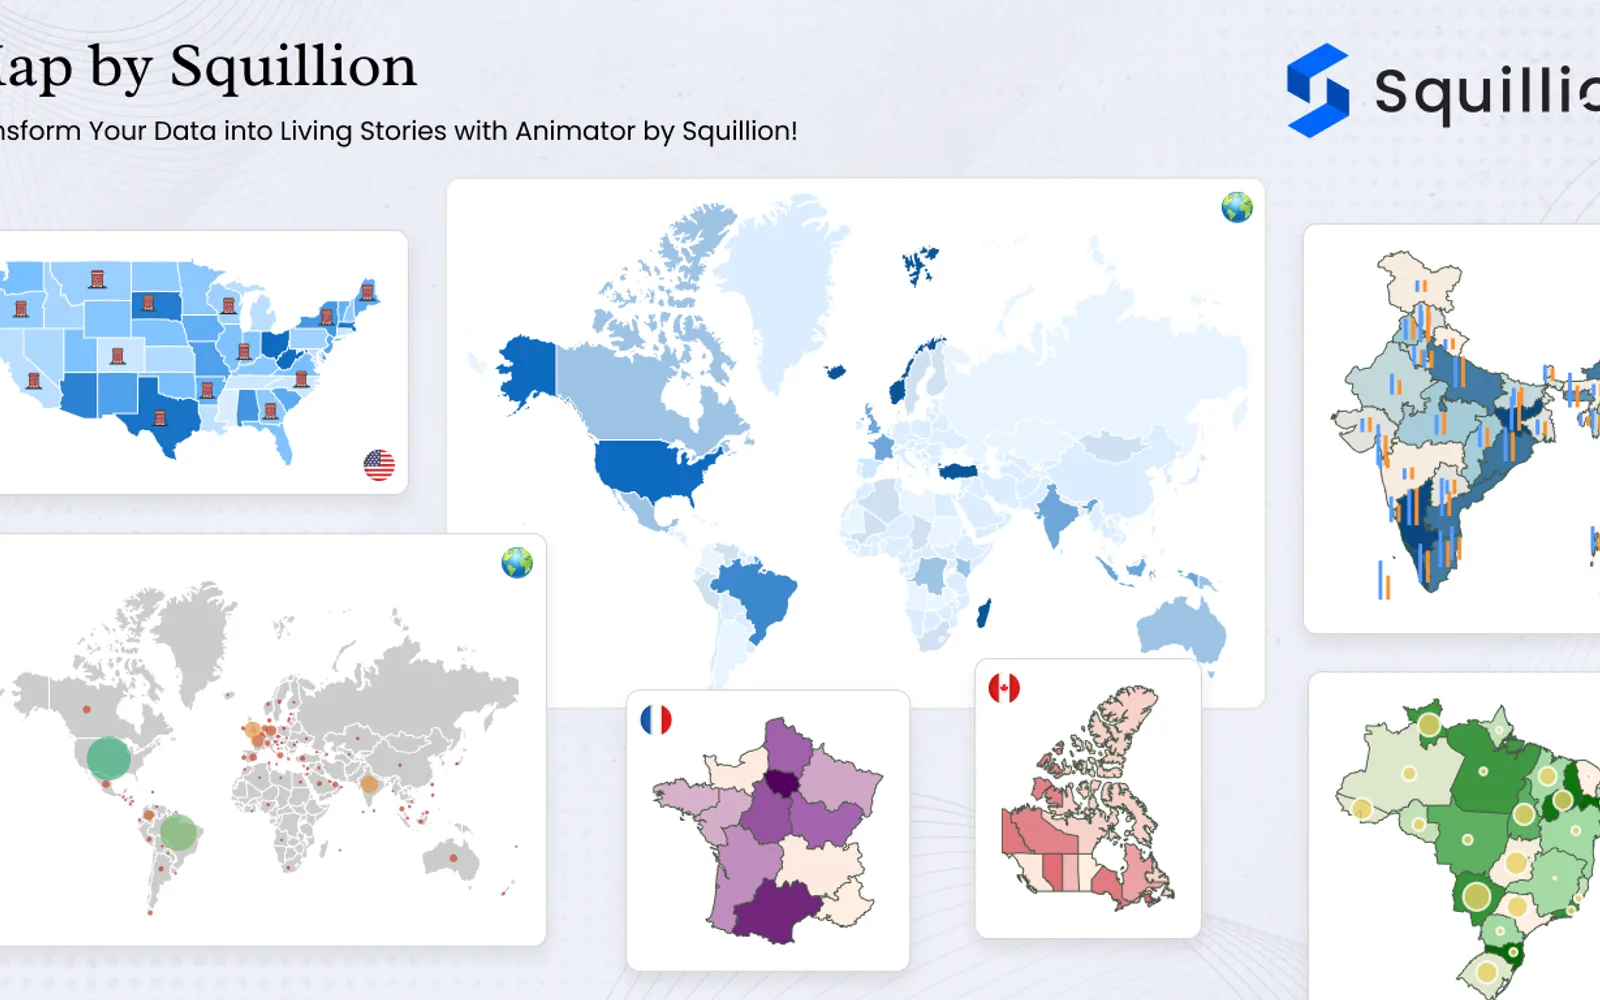
Map by Squillion displays geographic data as maps in Microsoft Power BI. It supports countries and custom GeoJSON or TopoJSON files, with color and formatting options. The visual can compare up to two fields, display numerical values as bubbles, and place markers using latitude and longitude coordinates. Markers can include categories and assigned values, and hovering over data points provides an interactive view.
Supports countries and custom GeoJSON or TopoJSON files.
Compares up to two fields directly on the map.
Displays numerical values as bubbles with configurable size and appearance.
Places markers using latitude and longitude coordinates and supports assigned values and categories.
Provides color and formatting options for the map visual.
Provides an interactive hovering effect over map data points.
Map by Squillion is free and cloud-deployed, while KML/KMZ Visual is paid and cloud-deployed. Smart Grid-Map and Drill Down Map PRO (Filter) by ZoomCharts are freemium and cloud-deployed. Ridgeline Plot by Powerviz and Synoptic Panel Lite by OKVIZ are free and cloud-deployed. Map by Squillion was updated in Aug 2026, compared with KML/KMZ Visual in Feb 2026, Smart Grid-Map in Dec 2025, Drill Down Map PRO (Filter) by ZoomCharts in Aug 2026, Ridgeline Plot by Powerviz in Jul 2026, and Synoptic Panel Lite by OKVIZ in Jul 2026.
| Name | Pricing | Deployment | Updated |
|---|---|---|---|
| this plugin | Free | Cloud | |
| Smart Grid-Map | Freemium | Cloud | |
| Drill Down Map PRO (Filter) by ZoomCharts | Freemium | Cloud | |
| Ridgeline Plot by Powerviz | Free | Cloud | |
| Synoptic Panel Lite by OKVIZ | Free | Cloud |
657 plugins in Power BI · Analytics
Price distribution: 73 free, 108 freemium, 441 paid, 35 price not published
KML/KMZ Viewer renders points, lines, and polygons from KML and KMZ files on interactive maps within Power BI reports.
Abdalla Dabes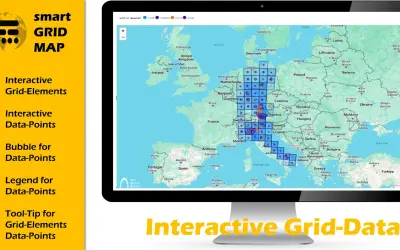
Smart Grid-Map is a custom Power BI visual for visualizing and analyzing grid and raster data with interactive polygons.
The Green Bridge GmbH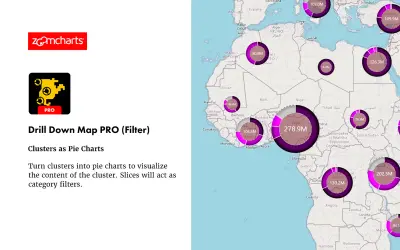
Drill Down Map PRO (Filter) by ZoomCharts visualizes and filters location data on interactive maps for Power BI Desktop reports.
ZoomCharts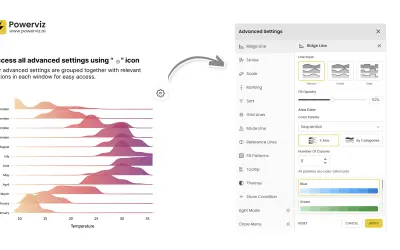
Custom Power BI visual that plots numeric distributions for multiple categories as stacked curves along a common continuous axis.
TRUVIZ INC«Along with all the Countries, Custom GeoJSON/TopoJSONs are now supported! We’re proud to support organizations that make a difference. Map by Squillion is now offering a Free Premium Plan for non-profit organizations, including schools and universities! (To get access, contact us at: info@squillion.tech with your …»