
Gantt Chart
Gantt Chart is a project management visual for Microsoft Power BI that tracks schedules, milestones, and resource workloads.
ChartPadFree
Syncs SharePoint list item data into SQL databases for reporting in Power BI or ThorApps BI Service.
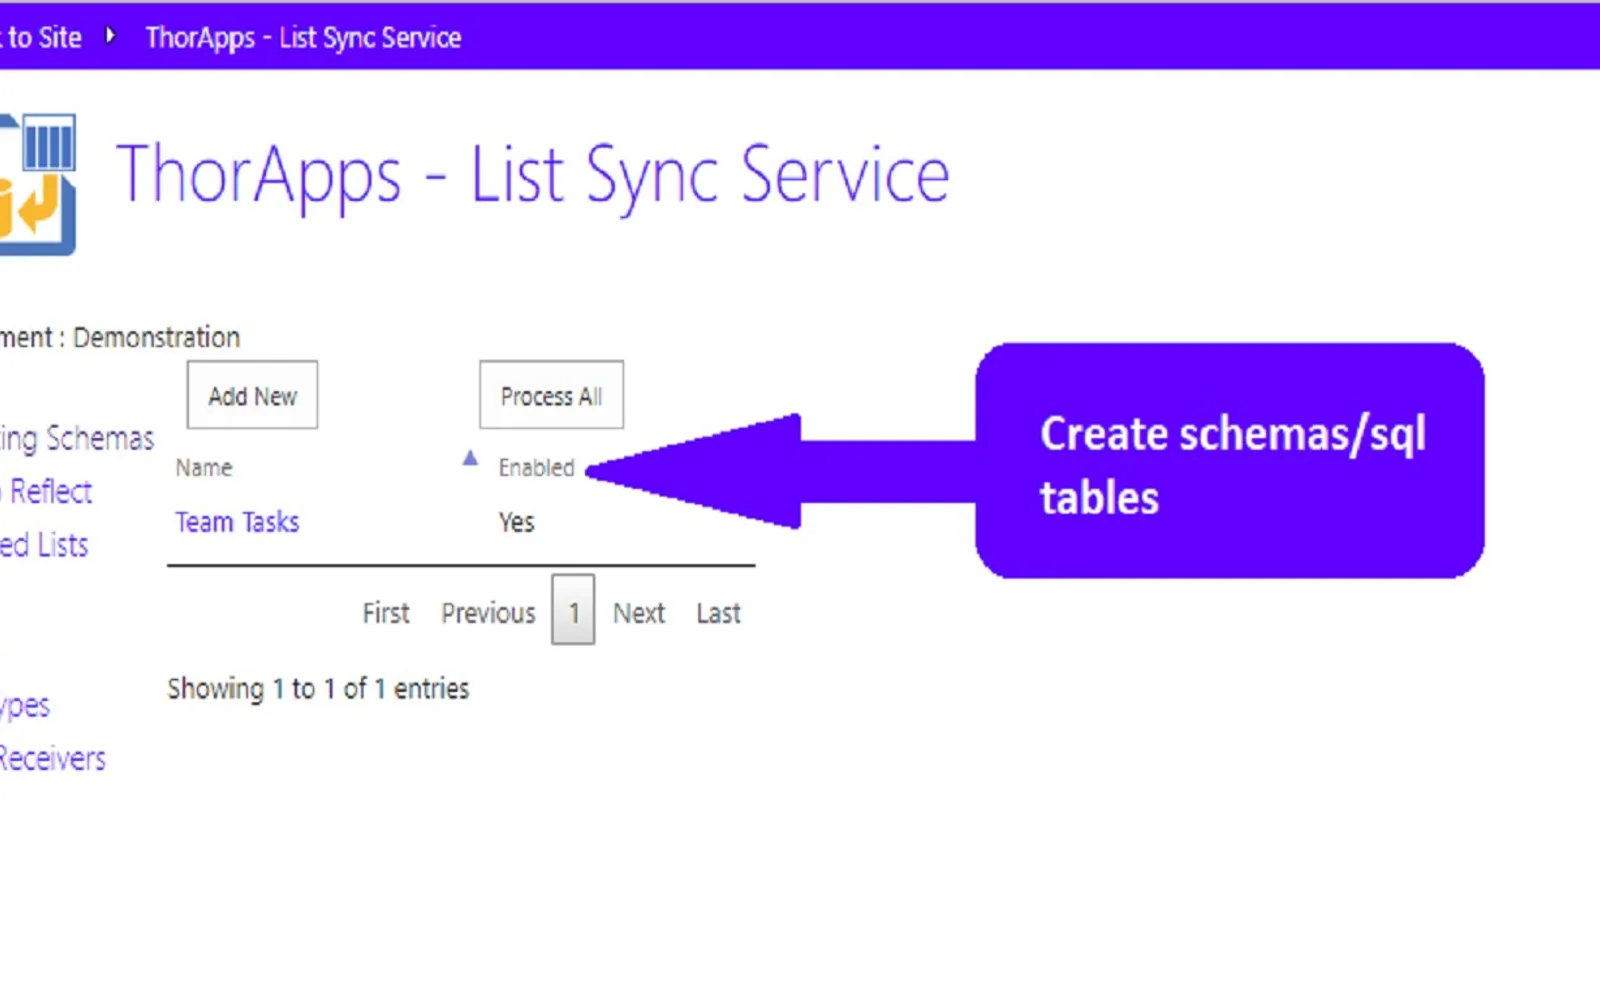
ListSync brings list item data from SharePoint into a SQL database. It can combine items from multiple sites and site collections. The SQL data can be used for real-time reporting with Power BI or ThorApps BI Service and for integration with other business systems.
Brings SharePoint list item data together in a SQL database.
Collates list items from multiple sites and site collections.
Enables real-time reporting from list data.
Allows SQL to be used with SharePoint data for reporting and analysis.
Provides integration with other business systems.
877 plugins in Power BI · Analytics
Price distribution: 74 free, 113 freemium, 497 paid, 193 price not published
Gantt Chart is a project management visual for Microsoft Power BI that tracks schedules, milestones, and resource workloads.
ChartPad
Creates visualizations from diverse chart types, combines multiple charts on one canvas, and adds custom annotations and tooltips.
Akvelon
Creates financial and business reports in Power BI with automatic variance calculations, P&L logic, and drill-down (s5, s6).
Zebra BI
AI analysis app for Dynamics 365 Business Central that provides customer KPIs, churn probability, and customer grouping.
Data Courage«ListSync brings your list item data together into a SQL database. Once your data is in SQL you can use your reporting tools (Power BI or the BI Service from ThorApps) to create amazingly fast reports. - Collate list items from multiple sites and site collections - Enable real-time reporting from your list data - Use …»