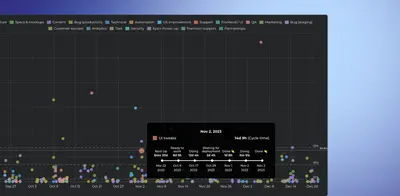
Analytics & Reports by Screenful
Creates charts and reports from Jira data, covering custom fields, sprints, worklogs, lead and cycle times.
ScreenfulFreemium
Create time-based graphs and custom burndown charts from Jira data.
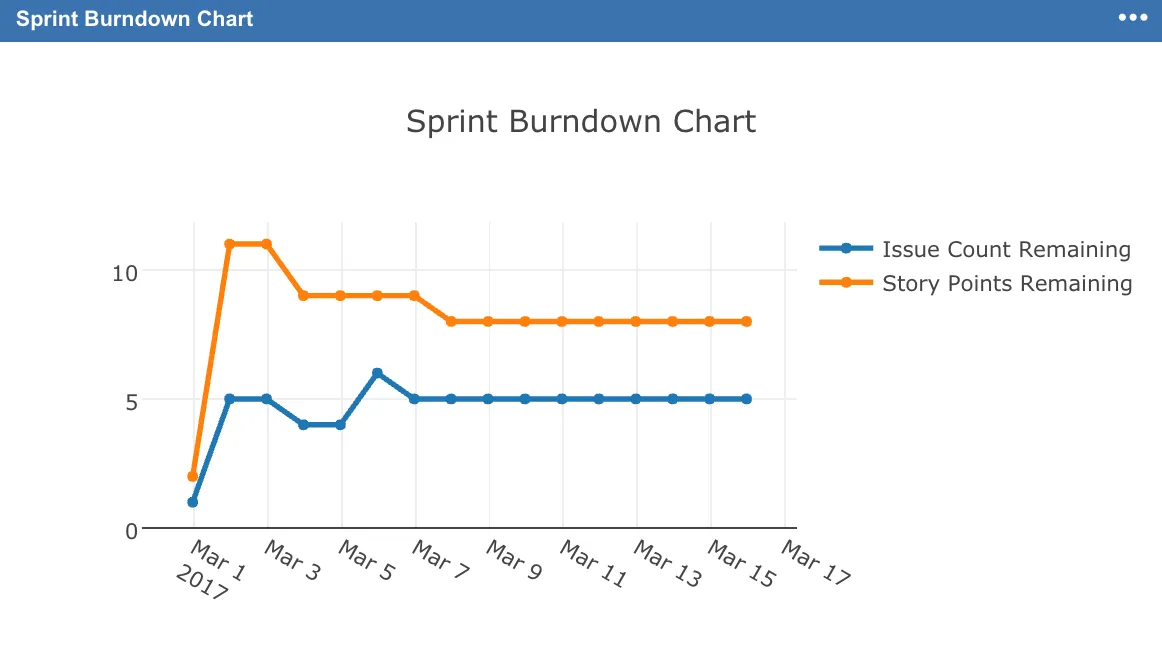
JavaScript Charts creates time series graphs from Jira data, with multiple datasets shown on one chart. It supports bar, line, spline and area styles, plus configurable titles, legends, colours and labels. Custom burndown charts can use JQL queries and metrics such as story points or issue count. Plotly graphs can be exported as PNG files or uploaded and edited online.
The add-in creates time series graphs from Jira data.
Multiple datasets can appear on the same graph.
Charts can use bar, line, spline or area styles with configurable titles, legends, colours and other styles.
Custom burndown charts can be built from JQL queries and sprint metrics such as story points or issue count.
Plotly graphs can be saved as PNG files.
Plotly graphs can be uploaded and edited online.
JavaScript Charts for Jira Cloud is free and cloud-only, while Analytics & Reports by Screenful is freemium and cloud-only, and Power Dashboards, Reports & Gadgets is paid with data-center and server deployment. Advanced Burndown Chart Dashboard Gadget for Jira supports data-center, cloud and server deployment.
| Name | Pricing | Deployment | Updated |
|---|---|---|---|
| this plugin | Free | Cloud | |
| Jira Cloud | Price not published | Cloud | |
| Analytics & Reports by Screenful | Freemium | Cloud | |
| Power Dashboards, Reports & Gadgets | Paid | Data Center · Server | |
| Advanced Burndown Chart Dashboard Gadget for Jira | Freemium | Cloud · Data Center · Server |
630 plugins in Jira · Data and analytics
Price distribution: 189 free, 230 freemium, 211 paid
Creates charts and reports from Jira data, covering custom fields, sprints, worklogs, lead and cycle times.
Screenful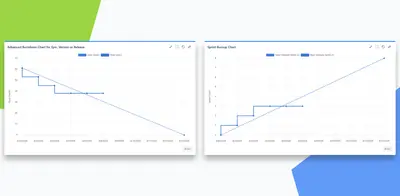
Create Jira dashboard burndown and burnup charts for sprints, epics, releases, versions, or JQL-filtered data.
Agilis LT (Simple Reports)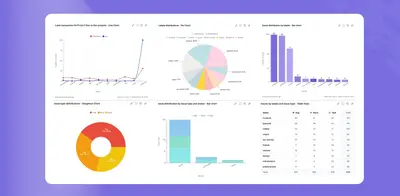
Create Jira dashboard charts and reports from issue data using multiple visual formats and filters.
Yamuno Software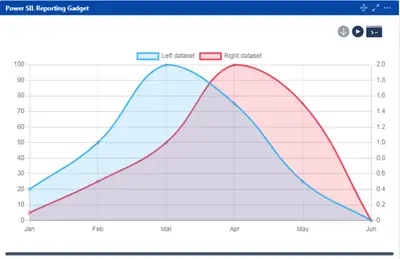
Create Jira reports, dashboards and visualizations using SIL, HTML, CSS and JavaScript.
Appfire«Time Series Charts Multiple datasets displayed on the same graph Bar, line, spline and area charts Customised chart title, legends, colours and styles Add labels to your chart at key points Save your Plotly graph as a PNG Upload and edit your Plotly graph online Burndown Charts: Create customised burndown charts based …»