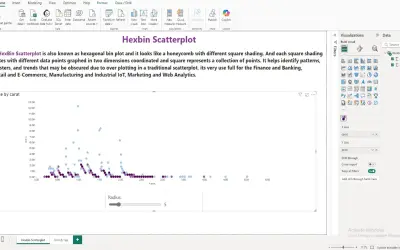
Hexbin Scatterplot by iFour
A Power BI visual that divides the data space into hexagonal bins to reduce overlap and visual clutter in large datasets.
iFour Technolab Pvt. Ltd.Paid
Create customizable charts and dashboards from spreadsheet data inside Microsoft Excel.
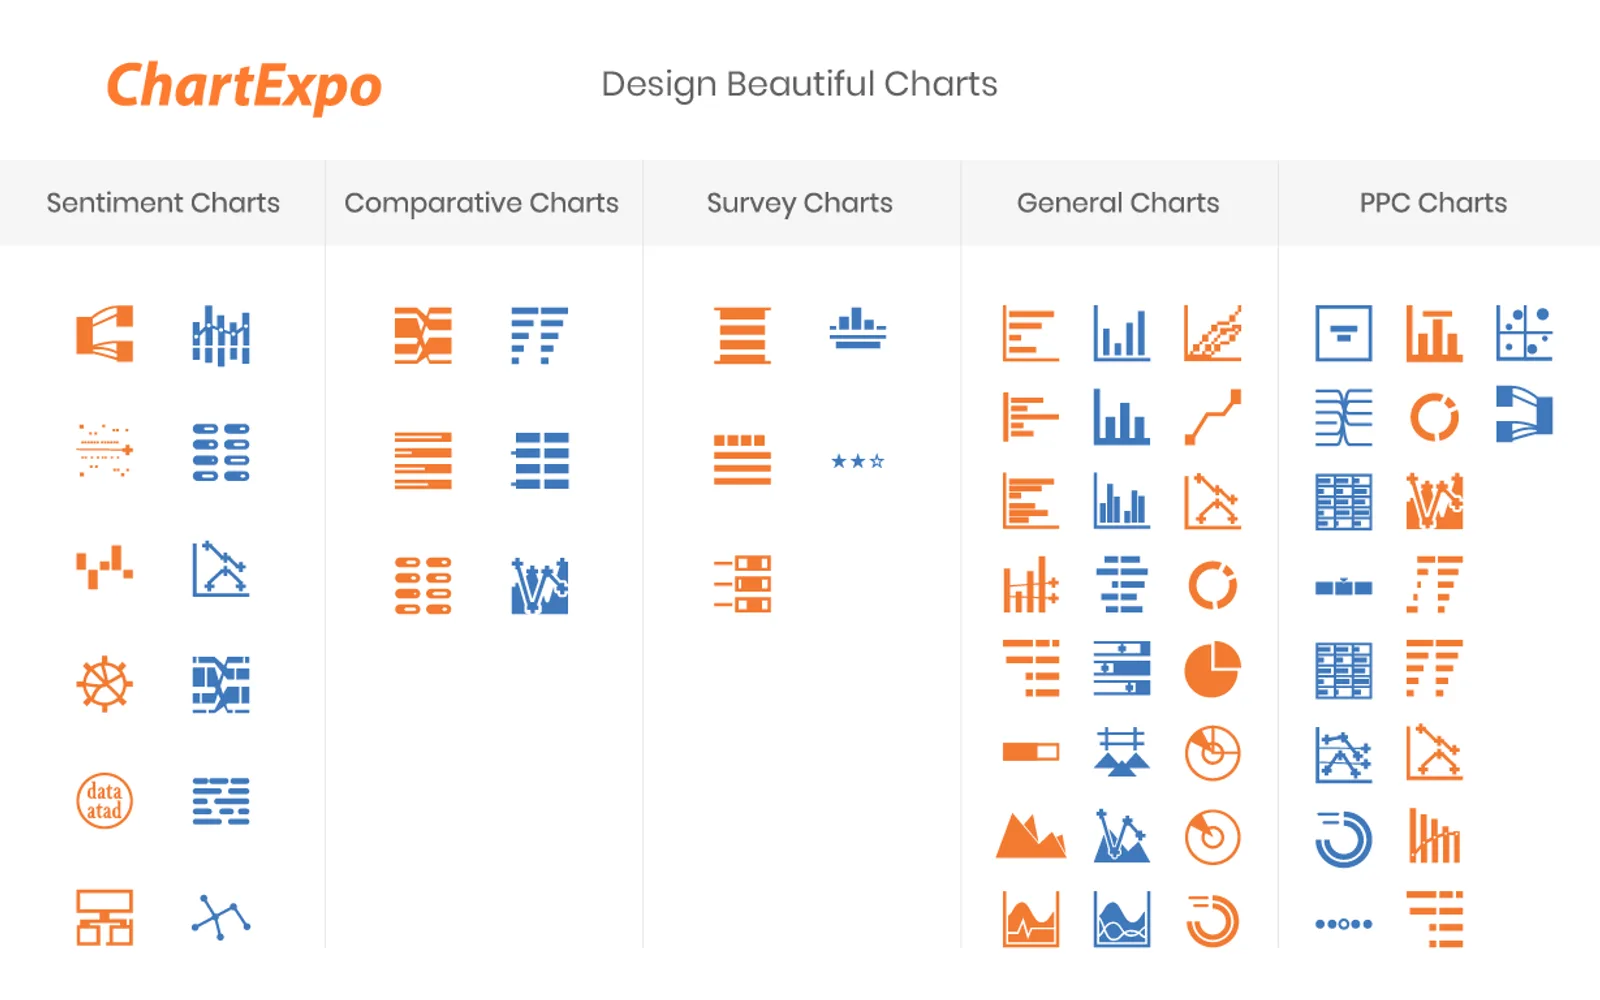
ChartExpo creates visualizations from Microsoft Excel spreadsheets, including network diagrams, flowcharts, comparison charts, dashboards, and survey charts. Users can adjust chart colors, fonts, and styles, then download visualizations as PNG, SVG, PDF, or JPG files. Charts can also be embedded in websites, posted on social media, or used in presentations and reports. The add-in provides chart types for financial analysis, surveys, customer feedback, trends, and other datasets.
Users can adjust visualization colors, fonts, and styles.
The add-in includes chart types such as Sankey diagrams, flowcharts, comparison charts, heatmaps, funnel charts, and survey charts.
Visualizations can be downloaded as PNG, SVG, PDF, or JPG files.
Charts can be used with PowerPoint and Google Slides for presentations.
Chart templates and reporting templates can be embedded in blogs or websites.
The vendor names business users, data analysts, marketing teams, small businesses, and enterprise users.
ChartExpo for Excel is listed as cloud-deployed with an unknown price type, while Hexbin Scatterplot by iFour, Eptura Workplace, Funnel Charts, and AI Financial Intelligence are listed as paid and cloud-deployed. Ridgeline Plot by Powerviz is listed as free and cloud-deployed. ChartExpo was updated on Jan 2026; the alternatives have listed update dates from Sep 2025 through Aug 2026.
| Name | Pricing | Deployment | Updated |
|---|---|---|---|
| this plugin | Price not published | Cloud | |
| Hexbin Scatterplot by iFour | Paid | Cloud | |
| Eptura Workplace | Paid | Cloud | |
| Funnel Charts | Paid | Cloud | |
| AI Financial Intelligence | Paid | Cloud | |
| Ridgeline Plot by Powerviz | Free | Cloud |
1,712 plugins in Power BI · Analytics
Price distribution: 91 free, 139 freemium, 718 paid, 764 price not published
A Power BI visual that divides the data space into hexagonal bins to reduce overlap and visual clutter in large datasets.
iFour Technolab Pvt. Ltd.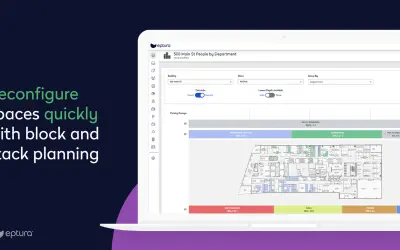
Provides space planning, occupancy monitoring, and real estate planning tools for the Eptura Workplace product.
Eptura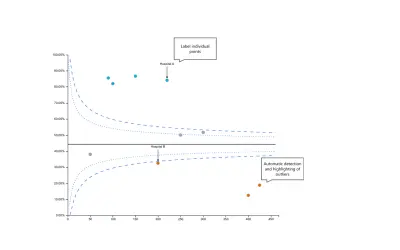
Builds no-code funnel plots for Power BI, covering proportions and ratios of counts, with export to PDF and PowerPoint.
Government of Western Australia - Department of Health
Discover the why behind your data.
Data Courage«ChartExpo is a data visualization add-in for Microsoft Excel that simplifies creating impactful charts from spreadsheets. It allows users to generate various custom visualizations, like network diagrams, flowcharts and comparison charts, and integrates seamlessly with Excel. Overwhelmed With Data, Starving For …»