
Gantt Chart
Gantt Chart is a project management visual for Microsoft Power BI that tracks schedules, milestones, and resource workloads.
ChartPadFree
Provides executive, customer, and category dashboards for granular business data analysis in Power BI.
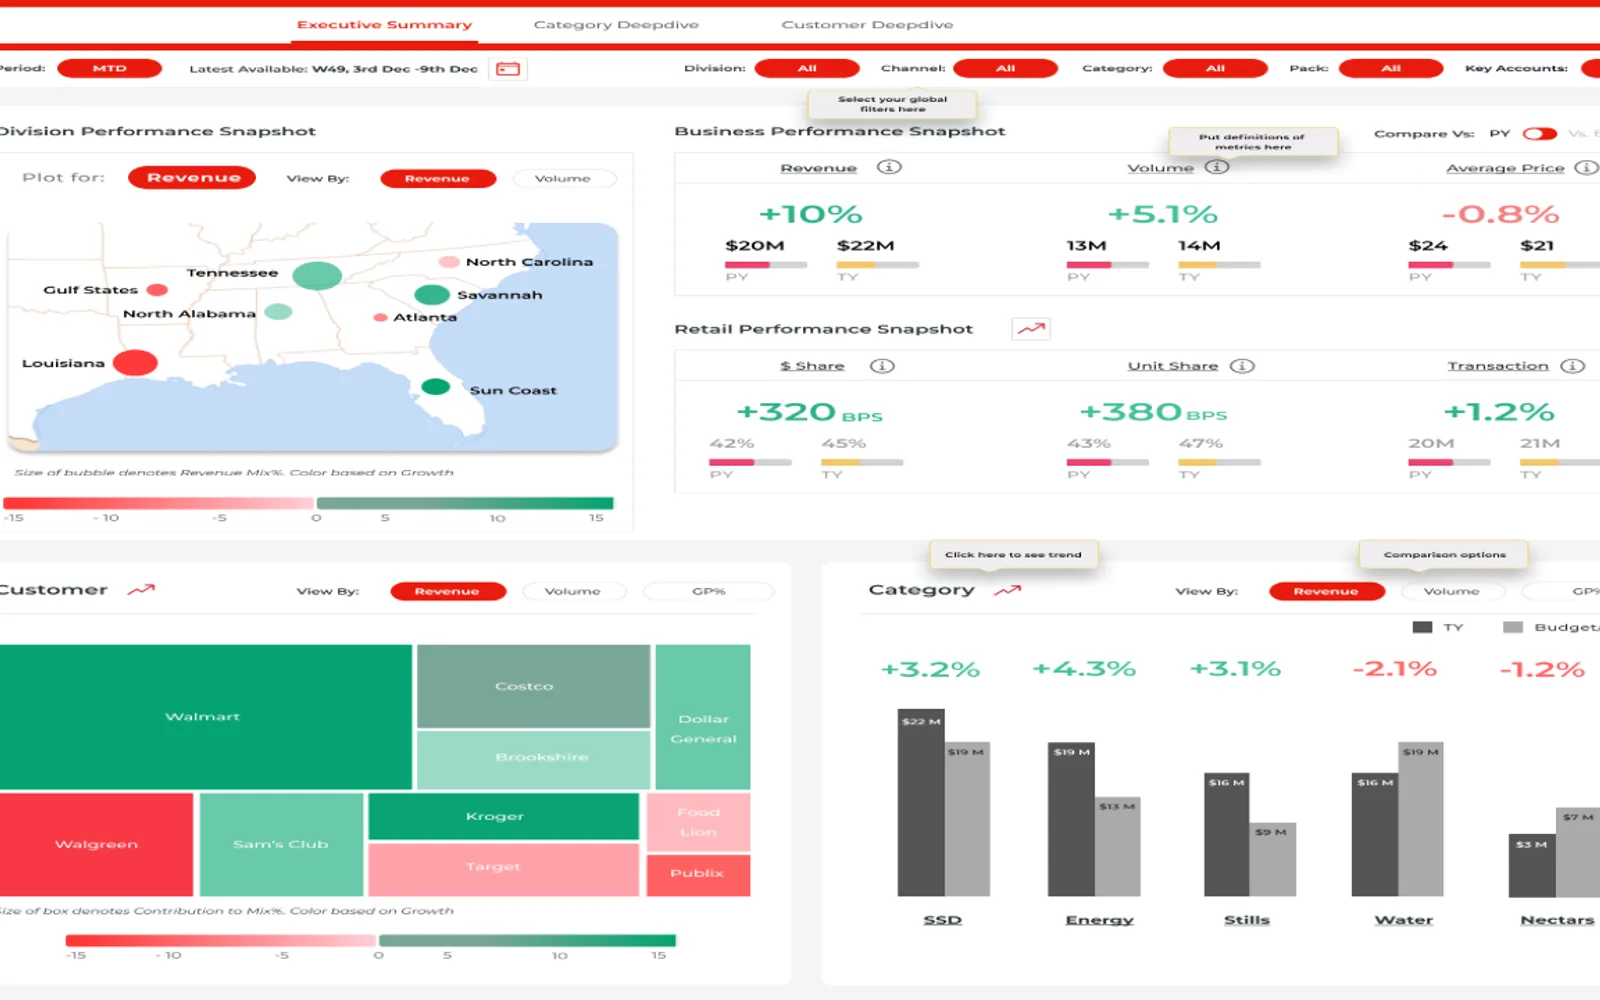
Provides three dashboard groups: Executive Summary, Customer Deep-Dive, and Category Deep-Dive. The Executive Summary covers business performance, sales trends, market share, KPI drivers, and top- and bottom-selling SKUs, with interactive drill-down charts. Customer Deep-Dive compares key account performance across products, markets, formats, and sales divisions. Category Deep-Dive compares revenue, price, profit, value share, distribution, assortment, brands, sales divisions, and customer channels.
Shows business performance, sales trends, market share snapshots, trend charts, waterfall charts, KPI drivers and draggers, and top- and bottom-selling SKUs.
Allows users to drill into business data through multiple interactive charts.
Analyzes key account performance by product and market hierarchies across business parameters.
Examines category revenue, price, profit, value share, distribution, and assortment.
2,531 plugins in Power BI · Analytics
Price distribution: 125 free, 147 freemium, 1,350 paid, 909 price not published
Gantt Chart is a project management visual for Microsoft Power BI that tracks schedules, milestones, and resource workloads.
ChartPad
Creates visualizations from diverse chart types, combines multiple charts on one canvas, and adds custom annotations and tooltips.
Akvelon
Creates financial and business reports in Power BI with automatic variance calculations, P&L logic, and drill-down (s5, s6).
Zebra BI
AI analysis app for Dynamics 365 Business Central that provides customer KPIs, churn probability, and customer grouping.
Data Courage«The Executive Dashboard comprises three sets of dashboards to have a more granular view of business data. Below are the details of all the dashboards:- 1. Executive Summary Dashboard - This Dashboard has below features:- a) A view to quickly show the Business performance, sales trend, and market share snapshot b) …»