
Gantt Chart
Gantt Chart is a project management visual for Microsoft Power BI that tracks schedules, milestones, and resource workloads.
ChartPadFree
Publish PowerPoint content and media to digital signage screens with DatabeatOMNI.
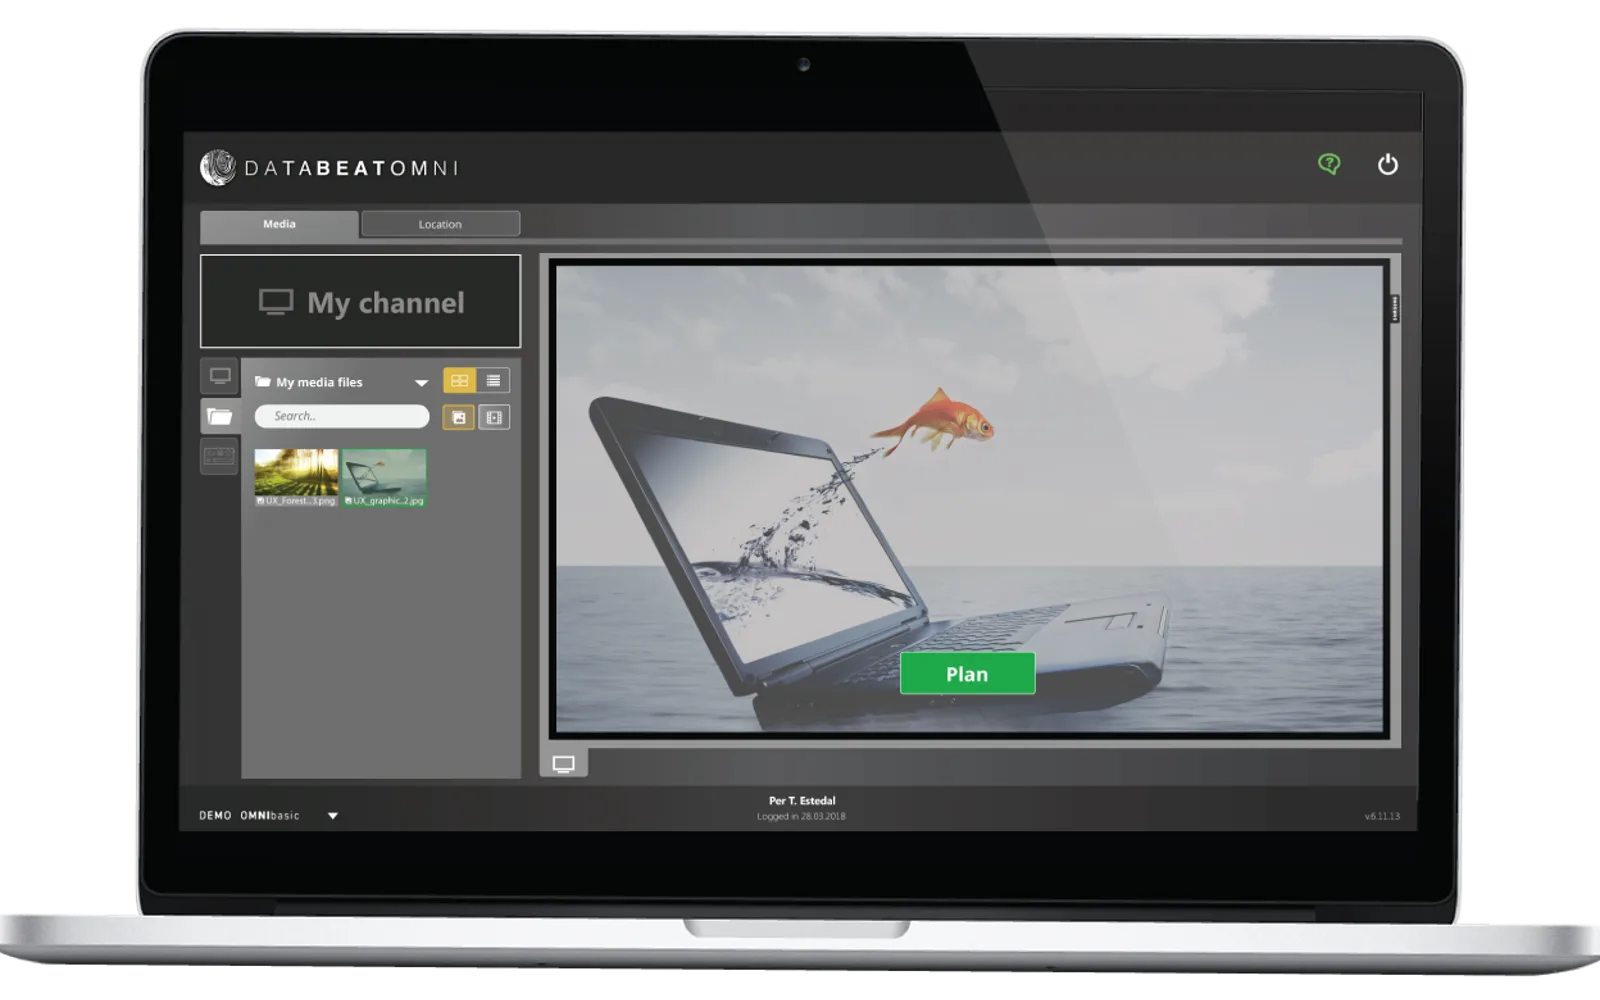
Creates channels with videos, graphics, and pictures, including content made in Microsoft PowerPoint. It provides access to personal, colleague, room, and resource calendars for doorsigns and overview screens. Screen Designer includes widgets for news, weather, graphics, clocks, counters, social media, and Power BI reports, dashboards, and visuals. Channels can be tested on a Windows 10 PC with OMNIcast and published with OMNIplay.
Creates content in Microsoft PowerPoint and publishes it without leaving PowerPoint.
Provides access to personal, colleague, room, and resource calendars based on Office 365 credentials.
Adds news, weather, graphics, clocks, counters, and social media widgets to channels.
Publishes Power BI reports, dashboards, and visuals through a Power BI widget.
Tests channels on a Windows 10 PC with the OMNIcast app.
744 plugins in Power BI · Analytics
Price distribution: 74 free, 110 freemium, 451 paid, 109 price not published
Gantt Chart is a project management visual for Microsoft Power BI that tracks schedules, milestones, and resource workloads.
ChartPad
Creates visualizations from diverse chart types, combines multiple charts on one canvas, and adds custom annotations and tooltips.
Akvelon
Creates financial and business reports in Power BI with automatic variance calculations, P&L logic, and drill-down (s5, s6).
Zebra BI
AI analysis app for Dynamics 365 Business Central that provides customer KPIs, churn probability, and customer grouping.
Data Courage«We are different, and we love it. Fortunately, so does our customers and partners. Join the growing community of happy DatabeatOMNI users. It’s free with your Microsoft account. In Databeat we genuinely believe that simplicity is the key to happy users and cost efficiency. For more than 15 years we have spent …»