
Gantt Chart
Gantt Chart is a project management visual for Microsoft Power BI that tracks schedules, milestones, and resource workloads.
ChartPadFree
Builds interactive data apps, dashboards, and reports for Power BI deployments.
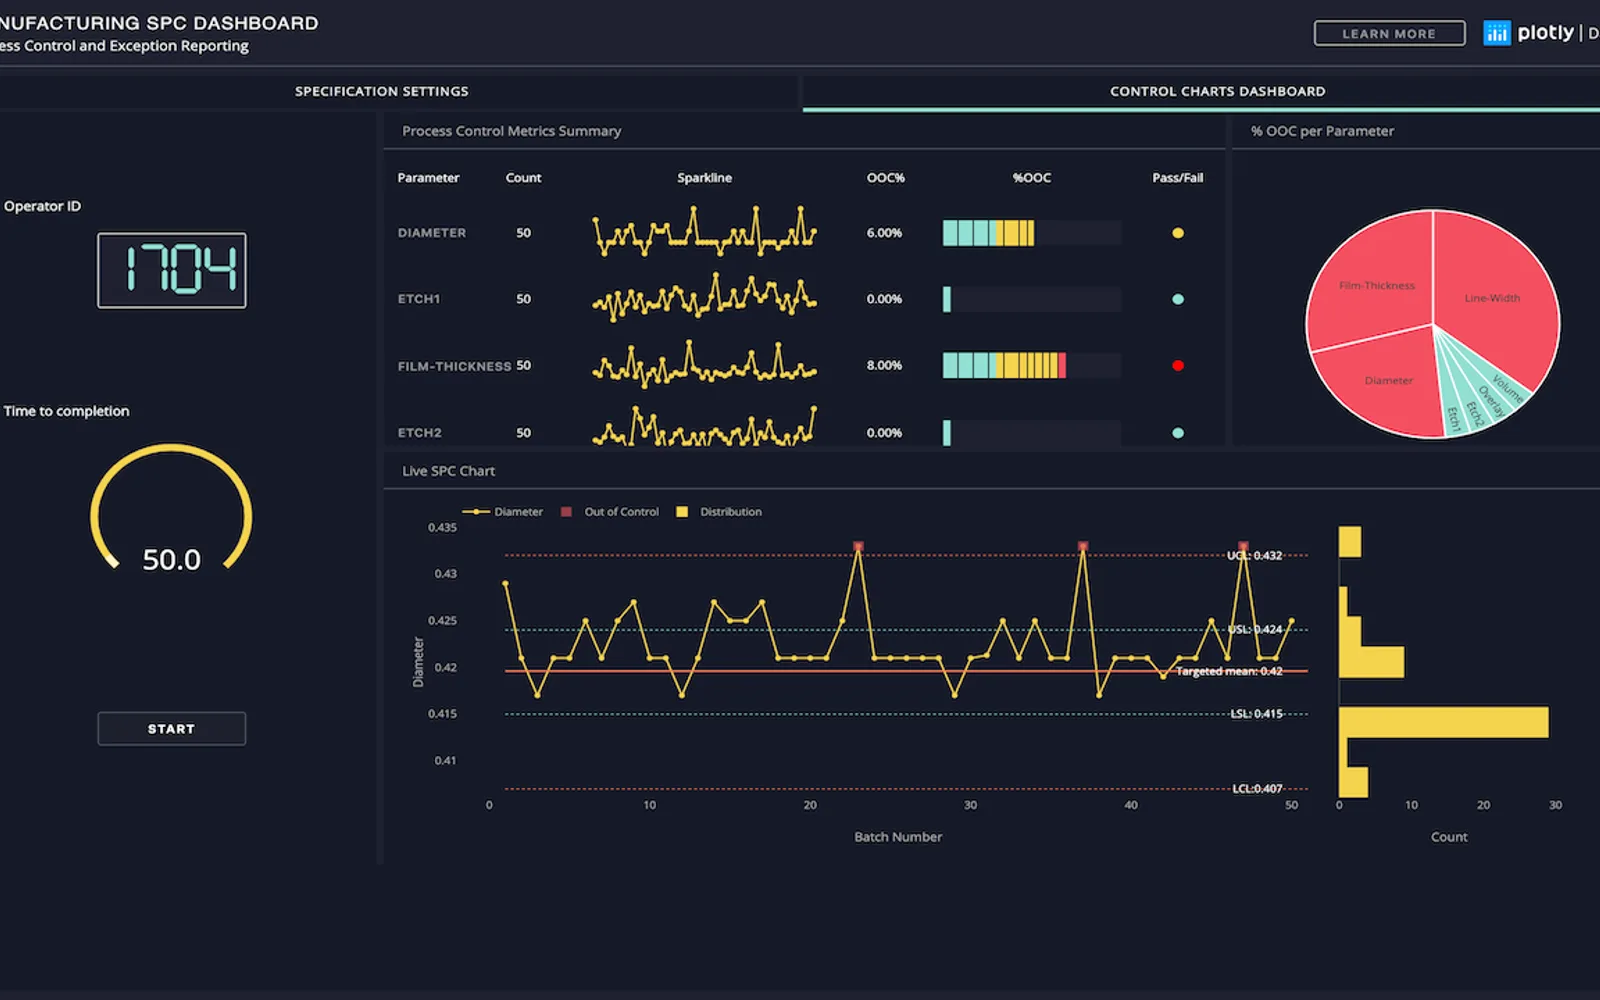
Provides tools for building data apps in Python from data sources. It augments Power BI deployments with interactive web apps and dashboards for machine learning, natural language processing, computer vision, and other analytics. Dashboards can accept user commentary and forecast inputs, while reports can be shared as links or PDFs. The platform runs in the cloud and uses Kubernetes for scaling analytic apps.
Adds dynamic, interactive web apps to Power BI deployments.
Runs dashboards with machine learning, natural language processing, computer vision, and other analytics.
Supports user interaction, data commentary, and forecast inputs.
Generates reports that can be shared as links or PDFs.
Runs analytic apps on a Kubernetes-based platform.
Integrates with Databricks and Jupyter notebooks.
657 plugins in Power BI · Analytics
Price distribution: 73 free, 108 freemium, 441 paid, 35 price not published
Gantt Chart is a project management visual for Microsoft Power BI that tracks schedules, milestones, and resource workloads.
ChartPad
Creates visualizations from diverse chart types, combines multiple charts on one canvas, and adds custom annotations and tooltips.
Akvelon
Creates financial and business reports in Power BI with automatic variance calculations, P&L logic, and drill-down (s5, s6).
Zebra BI
AI analysis app for Dynamics 365 Business Central that provides customer KPIs, churn probability, and customer grouping.
Data Courage«Plotly is a software company whose mission is to enable every company, around the world, to build data apps. Our product, Dash Enterprise, is a platform of best-in-class development tools to quickly and easily visualize data in Python from virtually any data source. With customers across the Fortune 500, Plotly is a …»