
Gantt Chart
Gantt Chart is a project management visual for Microsoft Power BI that tracks schedules, milestones, and resource workloads.
ChartPadFree
Manage integrated management systems in Power BI with modular standard requirements, process metrics, and reports.
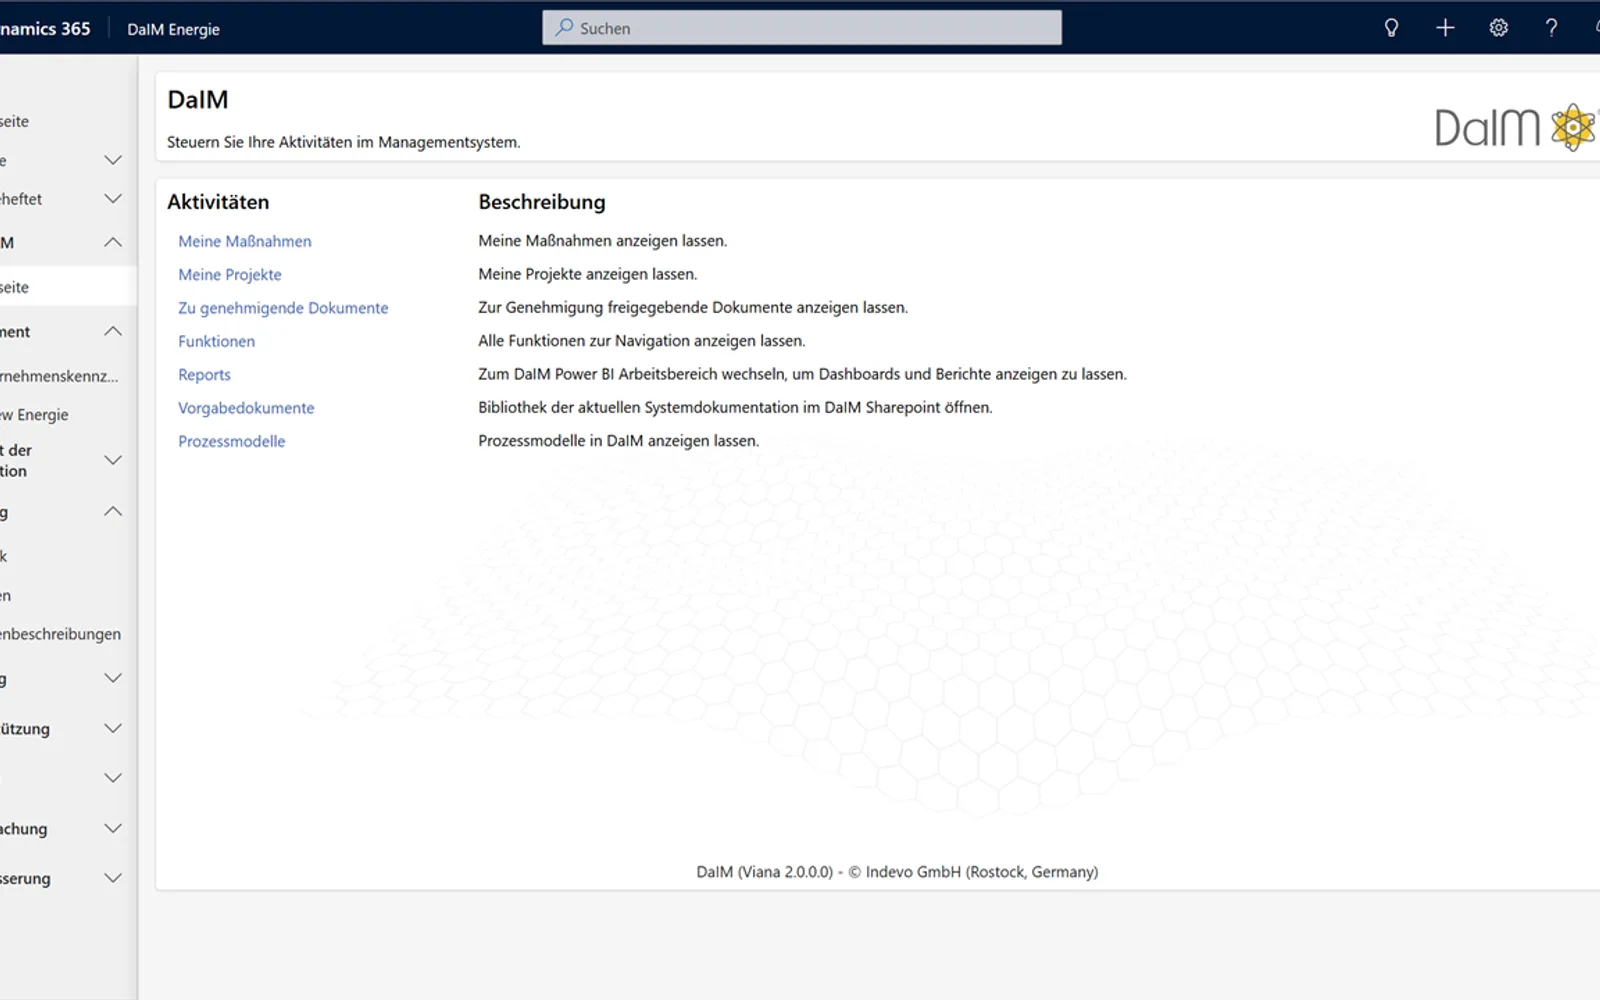
DaIM provides a modular system for integrated management systems, with modules for quality, environment, information security, occupational health and safety, and energy. It uses Power BI tools to produce process metrics and reports from data sources. A Microsoft Teams app supports communication and collaboration. The system can be accessed on smartphones and desktop computers.
Modules cover quality, environment, information security, occupational health and safety, and energy requirements.
Power BI tools provide process metrics derived from management system requirements.
The reporting tools work with almost any data source according to the vendor description.
A central app supports communication and collaboration in Microsoft Teams.
1,365 plugins in Power BI · Analytics
Price distribution: 89 free, 137 freemium, 651 paid, 488 price not published
Gantt Chart is a project management visual for Microsoft Power BI that tracks schedules, milestones, and resource workloads.
ChartPad
Creates visualizations from diverse chart types, combines multiple charts on one canvas, and adds custom annotations and tooltips.
Akvelon
Creates financial and business reports in Power BI with automatic variance calculations, P&L logic, and drill-down (s5, s6).
Zebra BI
AI analysis app for Dynamics 365 Business Central that provides customer KPIs, churn probability, and customer grouping.
Data Courage«What DaIM brings to your organization • DaIM is a modular solution for integrated management systems according to common ISO standards. Our core module is supplemented by standard-specific modules additional Quality, Environment , Information Security, Occupational health and safety and energy and is arbitrarily …»