
Power Plot Visual by Akvelon
Creates visualizations from diverse chart types, combines multiple charts on one canvas, and adds custom annotations and tooltips.
AkvelonFreemium
Compare actual values with target capacities or goals using cylindrical gauges.
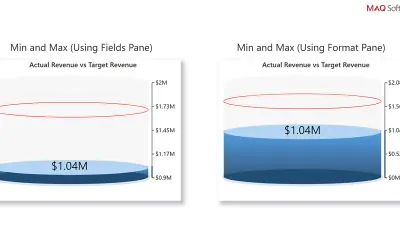
Cylindrical Gauge by MAQ Software is a 3D visual for comparing actual values with target capacities or goals. Each gauge represents a metric. Settings include value ranges, fill and border colors, vertical scrolling, and an optional fill line.
Set minimum and maximum values for tick marks.
Set fill and border colors.
Navigate through data with a vertical scrollbar.
Add a fill line indicator to the gauge.
2,531 plugins in Analytics
Price distribution: 125 free, 147 freemium, 1,350 paid, 909 price not published
Creates visualizations from diverse chart types, combines multiple charts on one canvas, and adds custom annotations and tooltips.
Akvelon
Creates financial and business reports in Power BI with automatic variance calculations, P&L logic, and drill-down (s5, s6).
Zebra BI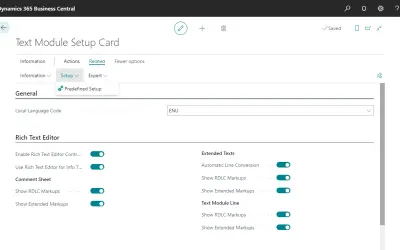
COSMO Text Module provides extended text management with a WYSIWYG editor for Microsoft Dynamics 365 Business Central.
COSMO CONSULT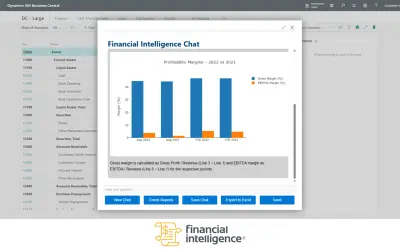
Discover the why behind your data.
Data Courage«Cylindrical Gauge by MAQ Software Transform your data into actionable insights with the Cylindrical Gauge by MAQ Software. This intuitive 3D visual tool is perfect for comparing actual values against target capacities or goals. Designed for simplicity and efficiency, each gauge represents a unique metric, allowing for …»