
Gantt Chart
Gantt Chart is a project management visual for Microsoft Power BI that tracks schedules, milestones, and resource workloads.
ChartPadFree
Connects UNFI Supplier-In-Site data to Crisp for dashboards and analysis in Power BI.
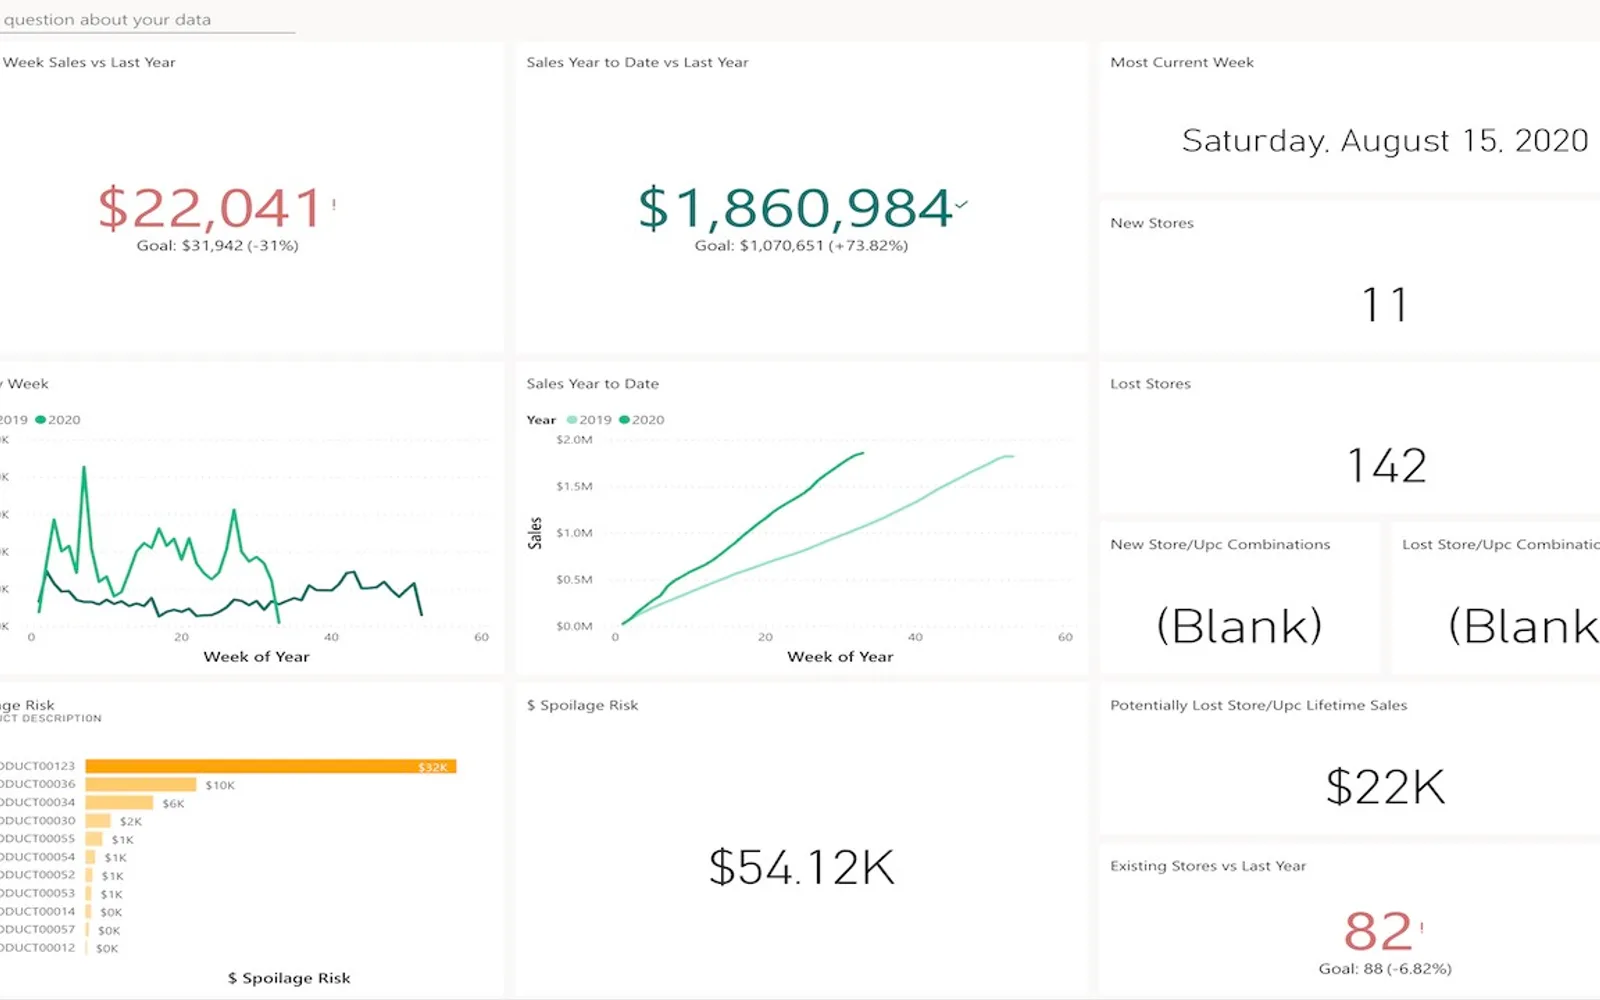
Crisp connects to the UNFI Supplier-In-Site portal and imports portal data into the Crisp platform. The connection transfers data automatically and regularly in one direction from UNFI to Crisp. Available data includes sales by customer, distribution center, and store, plus rankings, promotions, and chargebacks.
Connects to the UNFI Supplier-In-Site portal and imports portal data into Crisp.
Provides sales data by customer, distribution center, and store.
Provides brand versus category leaders, retailer ACV rank, and category rank.
Provides access to promotion information from the UNFI portal.
Provides access to chargeback information from the UNFI portal.
Supports shared dashboards and analytics in the cloud.
UNFI supplier partners and organizations using the UNFI Supplier-In-Site portal.
657 plugins in Power BI · Analytics
Price distribution: 73 free, 108 freemium, 441 paid, 35 price not published
Gantt Chart is a project management visual for Microsoft Power BI that tracks schedules, milestones, and resource workloads.
ChartPad
Creates visualizations from diverse chart types, combines multiple charts on one canvas, and adds custom annotations and tooltips.
Akvelon
Creates financial and business reports in Power BI with automatic variance calculations, P&L logic, and drill-down (s5, s6).
Zebra BI
AI analysis app for Dynamics 365 Business Central that provides customer KPIs, churn probability, and customer grouping.
Data Courage«Overview UNFI (United Natural Foods Inc.) shares reports with their supplier partners through its online Supplier-In-Site (SIS) portal reports. Get the most out of your UNFI sales data with Crisp. With compelling dashboard views, the Crisp platform augments your UNFI supplier portal data by automatically interpreting …»